Abstract
The high-frequency force-balance (HFFB) technique is one of the most popular methods for assessment of the wind-induced response of tall buildings. Before the measured data being processed, an additional treatment should be made to modify the amplification caused by the model-balance system. This procedure requires determining the dynamic parameter of the model-balance system first. The knocking test method is usually adopted to identify the natural frequency and damping ratio of the model-balance system. However, there are some shortcomings of this approach. First, it requires an additional knocking test, and second, the identified damping ratio by adopting the knocking method is only the structural damping of the model-balance system and the aerodynamic damping of the model is neglected. In this study, a new approach is proposed to identify the natural frequency and damping ratio of the model-balance system based on the measured data in wind tunnel tests. The knocking test is no longer necessary and the identified damping ratio is the entire damping ratio of the model-balance system, that is, the structural damping and the aerodynamic damping are both included. Three illustrative examples, including a hypothetical building, the Commonwealth Advisory Aeronautical Research Council (CAARC) tall building, and two actual buildings with rectangular and nonrectangular cross-sections, are considered to examine the validation of the proposed method. It is shown that the damping ratio of the model-balance system is different under different wind directions, and the actual power spectral density (PSD) of the overturning moments at the base of the model can be calculated accurately by adopting these identification results.
1. Introduction
The HFFB technique is one of the most widely adopted methods for the assessment of the wind-induced response of tall buildings. It is extremely easy and quick from a practical point of view, while being able to give a quantification of overall wind loads on the building. This technique allows users to measure the base reactions of a rigid scale building model through a balance at its base [1-7]. In recent years, a lot of work has been done to improve the HFFB technique for engineering applications, such as nonlinear mode shape corrections, multi-force balance measurements, and using HFFB model to identify aeroelastic parameters [3, 5-6, 8-15], etc.
A HFFB usually measures six force components, including the shear forces along two horizontal main axes directions, the axis force in vertical direction, the overturning moments along two main horizontal directions and the torque in vertical direction, at the base of a building model in wind tunnel. If the building model and the HFFB together are regard as a system (called model-balance system), the measured data are the output of the system. It is obvious that the input of the system is actually the external wind excitation acting on the building model. Therefore, the input of the system must be extracted from the measured output of the system.
In frequency domain, the input and output of a system are connected through the mechanical admittance. Their relationship can be expressed by the following equation:
where is the frequency, is the PSD of the measured amplified response of at the base of a model, is the PSD of the aerodynamic force, moment or torque at the base, and is the mechanical admittance of the force-balance system. According to Eq. (1), an additional treatment is usually made to modify the amplification caused by the model-balance system in the high frequency band as:
here and could be the PSD of overturning moment, the shear force or the torque at the base of a model-balance system. Among them, the overturning moments along the two main horizontal axes of the model are the most important for analysis of structural response, because the generalized wind loads for the first two sway mode of the structure can be deduced from them through the linear vibration mode shape assumption.
To obtain from the measured , the mechanical admittance must be determined first. It is obvious that the mechanical admittance of a model-balance system depends on its dynamic parameters, including the natural frequency and the damping ratio. Conventionally, a knocking test is usually conducted before a wind tunnel test to measure the free vibration signal of the system. Then, the dynamic parameters can be identified by analyzing the free vibration signal and then the mechanical admittance can be determined. After that, the PSD of wind loads on the building model can be obtained using Eq. (2).
However, there are some shortcomings of this method. First, laboratory technicians usually knock the building model with a rubber hammer in a knocking test. This procedure is usually carried out before or after the wind tunnel test. Therefore, the natural frequency and damping ratio of the HFFB system are assumed to be constants for all wind directions. Actually, the damping ratio of the model-balance system might change significantly when rotating the turn-plate to alter the wind direction. If the knocking test is re-conducted for each wind direction, a wind tunnel test would be interrupted for many times. In each time, the blower must be stopped to allow the technicians to enter the wind tunnel to conduct knocking. Obviously, this cumbersome procedure is infeasible. Second, the knocking force might be of great contingency in a knocking test. Different knocking force means different vibration amplitude of the recorded signal. Since many researchers have reported that the damping ratio is amplitude-dependent, the identified damping ratio base on the knocking test may not equal to the damping ratio of the model balance system when the building model is under wind load. The third, when the building model is acted by wind load in the wind tunnel, the damping of the model-balance system includes not only the structural damping but also the aerodynamic damping. The result of a knocking test can only represent the structural damping and the aerodynamic damping is usually neglected.
In this study, a new method for determination of dynamic parameters of a model-balance system is proposed. The advantage of this method includes: (1) the dynamic parameters of HFFB systems are identified based on the wind tunnel test data, and the additional knocking tests are no longer necessary; (2) the natural frequency and damping ratio of the model-balance system are not assumed to be constants for all wind directions. For each wind direction, the dynamic parameters would be re-identified based on the measured data. In other words, this method allows a model-balance system to have different dynamic parameters in different wind directions; and (3) the proposed procedure of dynamic parameters identification avoids identifying the structural damping and the aerodynamic damping separately, but identifies the entire damping ratio directly. Therefore, both the structural damping and the aerodynamic damping are included in the identification results.
The methodology is introduced in detail in the following section, and then three cases, including the CAARC standard tall building and two actual buildings with rectangular and nonrectangular cross sections, are studied to verify the effectiveness of the proposed method.
2. Methodology
In the first part of this section, the knocking method is introduced briefly, and then, the proposed method of this study is presented in detail.
2.1. The knocking test method
The knocking test is one of the most widely-used methods for obtaining the dynamic parameters of a model-balance system. The PSD of the measured decrement signal can be formulated as:
where , are the natural frequency and damping ratio of the model-balance system, respectively, and , , , . Eq. (3) can be rewritten as:
The coefficients , and can be obtained by fitting the right-hand side of Eq. (4), and then the natural frequency and damping ratio can be obtained from the following equations:
The knocking test method makes sense theoretically, but there would be some problems in applications, which will be illustrated and discussed in case studies in Section 3 of this paper.
2.2. The proposed method
Different than the knocking method, the proposed method in this study use the wind tunnel test data directly to identify the dynamic parameters of a model-balance system, that is, knocking tests are no longer necessary. Since the overturning moments along the two main horizontal axes at the base of a model are the most important for analysis of structural responses, the following analysis focuses on these two directions.
The mechanical admittance of a model-balance system can be expressed as:
Substituting Eq. (6) into Eq. (1) gives:
The PSD of the overturning moments along two horizontal main axes of super-tall buildings usually decreases approximately linearly with the increase in frequency in a specified frequency range in log-log coordinate. This feature can be formulated as:
Eq. (8) can be rewritten in logarithmic format as:
Eq. (9) reveals that the relationship between and can be fitted with a straight line. Eq. (7) can be rewritten as:
The measured signal by the HFFB is a kind of discrete signal, thus is also discrete in frequency domain and can be rewritten in a discrete form according to Eq. (10) as:
where and are the value of and at frequency . The corresponding fitted value is expressed as:
Now the problem is to find a set of , , and to minimize the relative error, in terms of , between and , which can be formulated as:
The value of , , and can be determined by solving the following equations:
Substituting Eqs. (11) and (12) into Eqs. (14) gives:
Eq. (15) can be rewritten as:
Now there are four equations in four unknowns, thus the dynamic parameters and can be determined by solving these nonlinear equations. Some numerical methods can be employed to solve nonlinear equations. In this study, a modified Newton-Raphson algorithm, called the “secant” method is adopted to solve the systems of nonlinear equations. Consider the solution to a system of nonlinear equations in unknowns given by:
The system can be written in a single expression using vectors, i.e.:
where the vector contains the independent variables , and the vector contains the functions . The procedure to solve the equations is described as below.
1) Set the maximum number of iterations and the tolerance ;
2) Set the initial guess for the solution as .
3) Successive approximations to the solution are obtained from:
where is the Jacobian matrix and is the current iteration step number.
4) The convergence criterion is that the magnitude of the vector be smaller than the tolerance, as shown in Eq. (16). If Eq. (16) were satisfied, the iteration is ended and the unknown is determined. Otherwise, the iteration procedure goes to step (3):
The main difference between the secant method and the Newton-Raphson algorithm is how to calculate the Jacobian matrix . The former uses the secant value instead of the tangent value when calculating the Jacobian matrix. This method is easily implemented to solve the system of nonlinear equations which is shown in Eqs. (16a)-(16d). Therefore, the natural frequency and damping ratio of a force-balance system can be easily determined by adopting the proposed method.
3. Illustrative examples
In this section, three illustrative examples are presented to examine the validation of the proposed method. The first example is the standard tall building model proposed by CAARC (called the CAARC standard tall building). It is a hypothetical building. The other two examples are actual buildings including the Zhuoyue Century Center (ZCC) with rectangular cross-section and the Guangzhou East Tower (GZET) with nonrectangular cross-section.
3.1. Example I: the CAARC standard tall building
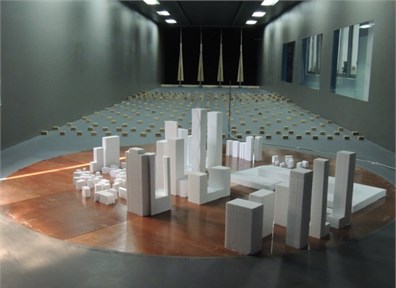
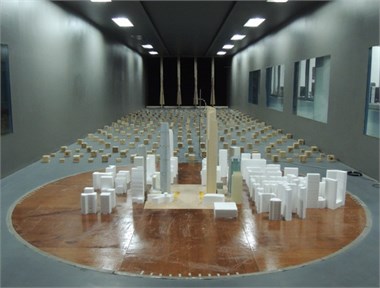
The CAARC standard tall building is characterized as a flat-topped prismatic body with rectangular cross-section and lateral flat walls presenting no parapets or other geometric details. The full-scale dimension of the building model are as follows: height 182.88 m; length 30.48 m and width 45.72 m. The HFFB wind tunnel test was carried out in the boundary layer wind tunnel at the South China University of Technology with a working section of 5 m wide and 3 m high. A rigid model with a geometric length scale of 1:300 was made to represent the CAARC building, as shown in Fig. 1. Spires and roughness elements were used to simulate a typical boundary layer wind flow specified in the Load Code of China (2012) as exposure Category C. The corresponding power law exponent is 0.22. In the wind tunnel test, the aforementioned six force or moment components at the base of the building model were measured by an ATI type high-frequency force-balance. The sampling frequency was 400 Hz and the sampling length was 40960. Wind direction varied from 0° to 350° with incremental step of 10° in the wind tunnel test.
Fig. 1The CAARC building model in wind tunnel tests
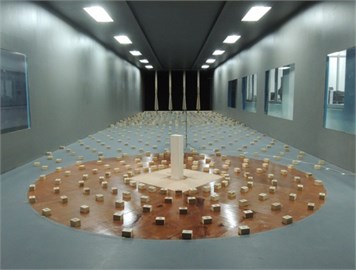
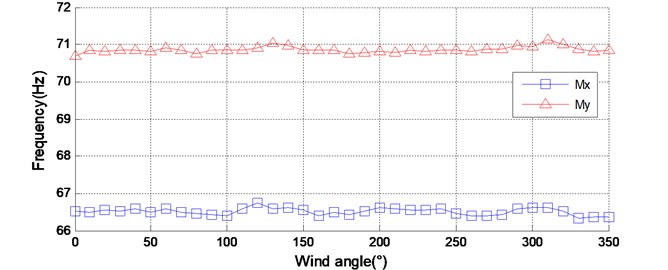
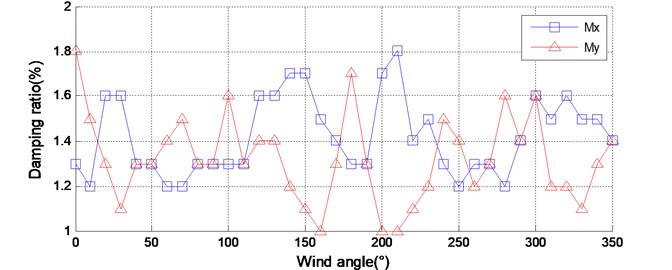
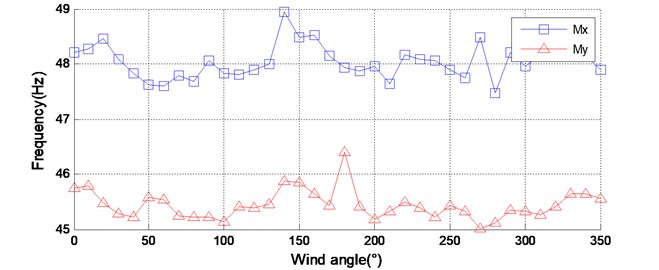
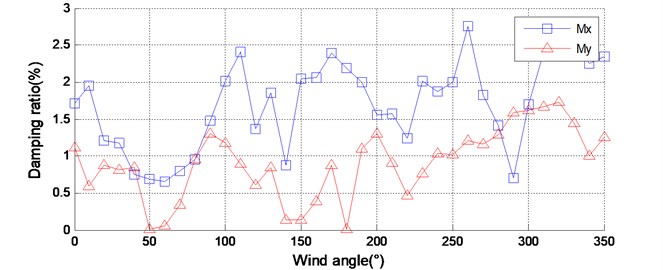
Fig. 2The identified dynamic parameters of the model-balance system of CAARC under different wind directions
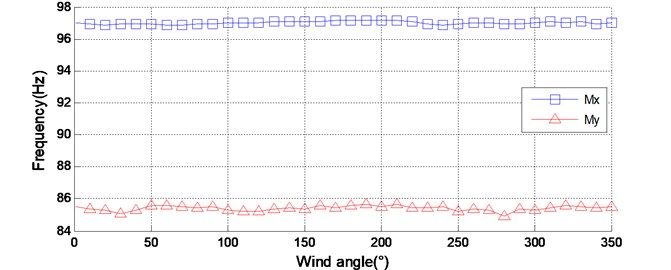
a) Natural frequency
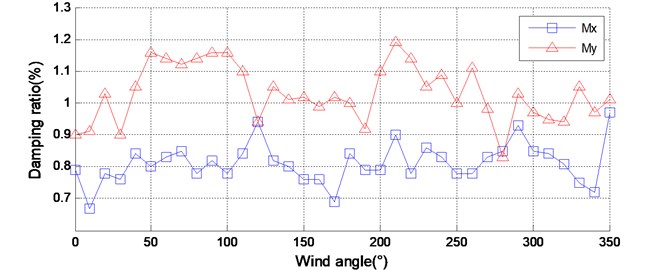
b) Damping ratio
Fig. 2 shows the identification results of the natural frequencies and the damping ratios of the model-balance system for all wind directions. It is shown that the natural frequency and damping ratio of the HFFB system under different wind directions are not quite the same. The identified natural frequency varies slightly with wind directions. However, the identified damping ratio varies more significantly with wind directions. For example, in direction, the maximum damping ratio is 0.97 % and the minimum damping ratio is 0.67 %. In direction, they are 1.19 % and 0.83 %, respectively. The phenomenon that the identified dynamic parameters vary with wind directions would be due to several aspects. First, altering wind direction is usually implemented by rotating the mechanical device at the base of the model-balance system. This procedure may cause slight changes of the dynamic parameters of the HFFB system. Second, the aerodynamic damping of the model-balance system usually varies with wind directions in wind tunnel tests. Obviously, the aerodynamic damping is a portion of the total damping of that system. Hence the damping of the model balance system varies significantly in different wind directions.
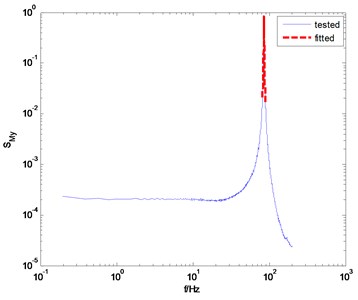
For the purpose of comparison, the knocking test was carried out and the identification results are presented as well. Before fitting coefficients shown in Eq. (3), the frequency range for fitting must be specified first. The frequency corresponding to the peak value of the spectrum is usually regarded as the center frequency of this frequency range, and the band width of the frequency range should be set artificially. Actually, it is difficult to determine an appropriate band width. The reason is that too wide band width would result in an overestimated damping ratio result, and too narrow bandwidth would result in an underestimated damping ratio result. For example, if the selected frequency range for fitting is [0.85, 1.15], the identified damping ratio in direction is 1.47 %, as shown in Fig. 3(a). However, if the frequency range is specified as [0.97, 1.03], the corresponding identified damping ratio is 0.56 %.
Fig. 3The overestimated and underestimated damping ratio according to different frequency range for fitting
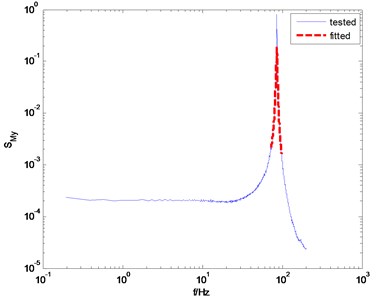
a) Fitting frequency range is [0.85 1.15] and identified damping ratio is 1.47 %
b) Fitting frequency range is [0.97 1.03] and identified damping ratio is 0.56 %
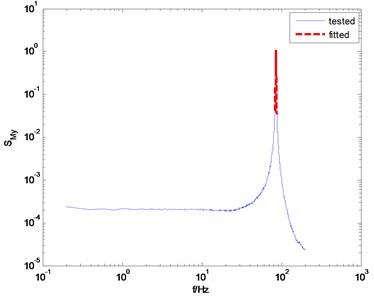
Fig. 4The measured and fitted PSD of the overturning moments
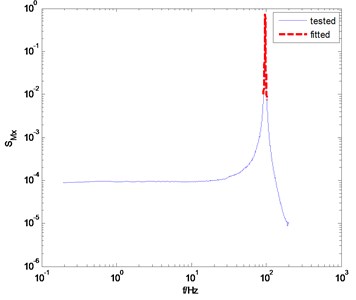
a) direction
b) direction
For the above reason, the appropriate frequency range for fitting is usually determined after many attempts. In each attempt, the relative error between the fitted PSD and the tested PSD is observed. One can minimize the relative error by adjusting the frequency bandwidth. Obviously, this is a cumbersome process, and it is one of the shortcomings of the knocking method. For this example, we find that the appropriate frequency range is [0.955, 1.045], and the fitted PSD are in good agreement with the tested PSD near the peak point of PSD, as shown in Fig. 4. The identified damping ratio is 0.53 % in direction and 0.65 % in direction. The corresponding natural frequencies of the model-balance system are 96.61 Hz and 85.41 Hz, respectively.
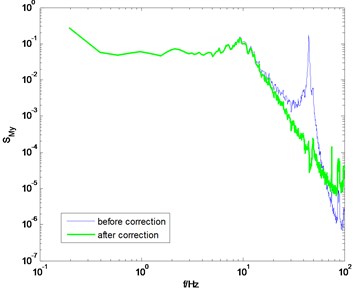
Using the identification results from the knocking method, the measured PSD of overturning moments are then modified, as shown in Fig. 5. It is shown that the correction results are not bad. But if we observe the corrected PSD near the natural frequency of the model-balance system, we can find that the influence of the dynamic parameters of the model-balance system is not entirely eliminated after correction. The reason is that the identified damping ratio from the knocking method is not suitable for all wind directions.
Fig. 5The PSD of overturning moments before and after correction (using the knocking method)
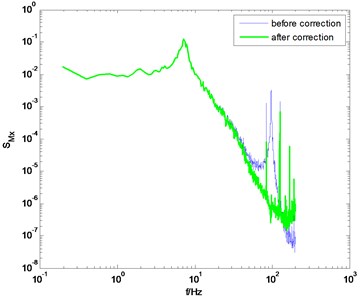
a) direction, 0° wind angle
b) direction, 0° wind angle
c) direction, 90° wind angle
d) direction, 90° wind angle
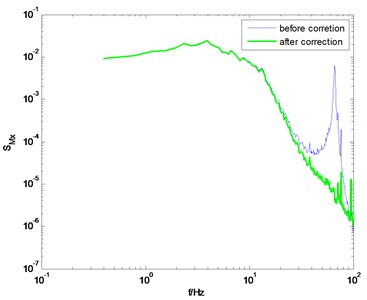
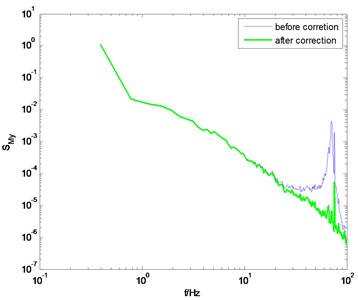
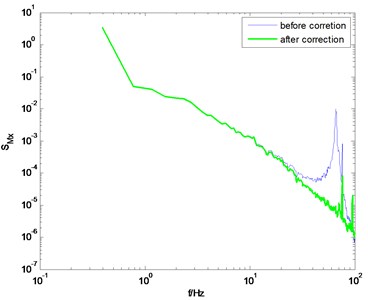
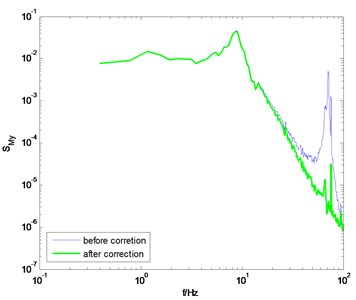
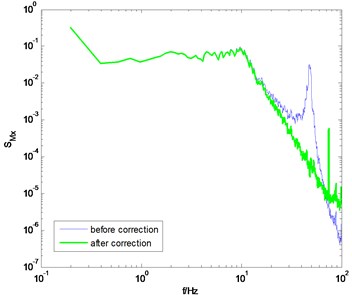
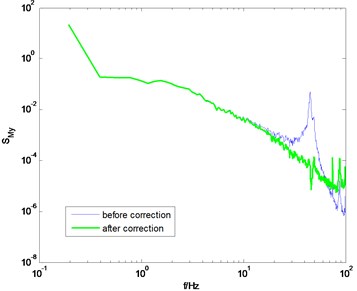
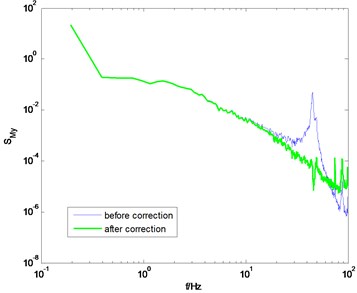
If the dynamic parameters of model-balance system are identified through the method proposed in this study, better correction results can be obtained. Some selected results in typical wind directions are shown in Fig. 6. Compared to the conventional knocking method, better correction results are achieved by adopting the proposed method in this study. Meanwhile, some singular points on the PSD curve degrade the correction quality. For instance, in Fig. 6(b) and 6(d), there are some singular points near the natural frequency of the model-balance system. These singular points make the PSD of unsmooth even after the correction. This phenomenon may be due to the noise component in the measured signal in wind tunnel tests. It should be eliminated using some signal processing techniques like wavelet transform, but this study does not cover this issue.
Fig. 6PSD of overturning moments of CAARC before and after correction using the proposed method
a) direction, 0° wind angle
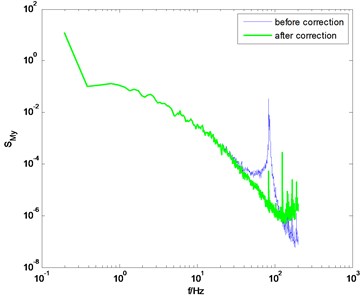
b) direction, 0° wind angle
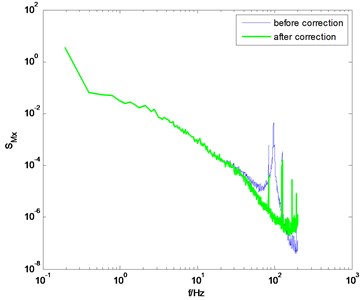
c) direction, 90° wind angle
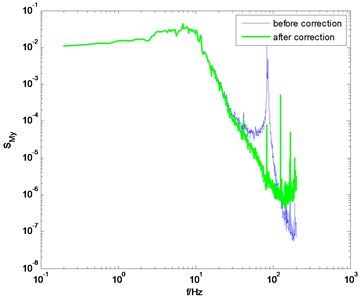
d) direction, 90° wind angle
Fig. 7ZCC building model in wind tunnel tests
3.2. Example II: the Zhuoyue century center
The previous example is a hypothetical building, and in this section, an actual building with rectangular cross-section is considered to examine the effectiveness of the proposed method. The ZCC, which is 280 m high with 68 stories, is located in Shenzhen, China. The HFFB wind tunnel test of ZCC was carried out in the boundary wind tunnel of the South China University of Technology. According to the Chinese load code for the design of building structures (GB 50009-2012), the exposure category C (corresponding to exponents of the power law of mean wind profile of 0.22) are simulated at a length scale of 1/400 by setting spires, barriers and rough element in the test area. The building model in the test area of the wind tunnel is shown in Fig. 7. The base forces and moments of the model were measured by an ATI force balance with sampling frequency of 400 Hz and sampling length of 40960. Wind direction varied from 0° to 350° with incremental step of 10° in the wind tunnel test.
Fig. 8Identified dynamic parameters of the model-balance system of ZCC
a) Natural frequency
b) Damping ratio
The proposed method is adopted to identify the natural frequency and damping ratio of the model-balance system. The obtained results are shown in Fig. 8. As well as the previous example, the identified natural frequency varies slightly with wind directions, and the identified damping ratio varies significantly with wind directions. Moreover, Fig. 8(b) shows the approximate symmetry of the identified damping ratio around 180° wind angle in both and direction, rasing the possibility that aerodynamic damping is an important part of a model-balance system.
The identification results shown in Fig. 8 are adopted to modify the measured PSD of the overturning moments at the base of the ZCC model. Fig. 9 shows the comparison of the PSD before and after correction. Good results are achieved though adopting the proposed method.
It should be pointed out that the correction quality is closely related to the quality of the measured PSD. If the measured PSD is highly smoothed, the corrected PSD would be of higher quality, otherwise, there would be some burrs on the corrected PSD, as shown in Figs. 6(a) and (d). In general, if the natural frequency of the model-balance system is relatively low, the measured force or torque signal is usually of high signal-noise-ratio, and thus better results can be achieved through the proposed method.
3.3. Example III: the Guangzhou east tower
The previous two examples are tall buildings with rectangular cross-section, and in this section, an actual building with nonrectangular cross-section is considered to examine the effectiveness of the proposed method. The GZET, which is 530 m high with 112 stories, is located in Guangzhou, China. Its main structure has been completed in October, 2014, and now it is the tallest building in Guangzhou and the second tallest building in South China. Fig. 10 shows a model mounted in the wind tunnel. The HFFB wind tunnel test of the GZET was carried out in the boundary wind tunnel of the South China University of Technology as well. According to ESDU’s suggestion, the power law of mean wind profile was simulated as 0.22. The force and torque at the base of the building model was measured by an ATI balance with sampling frequency of 400 Hz and frame number of 40960. Wind direction varied from 0° to 350° with incremental step of 10° in the wind tunnel test.
Fig. 9PSD of overturning moments of ZCC before and after correction using the proposed method
a) direction, 0° wind angle
b) direction, 0° wind angle
c) direction, 90° wind angle
d) direction, 90° wind angle
Fig. 10GZET model in wind tunnel tests
Using the method presented in this study, the natural frequency and the damping ratio for all wind directions are determined, as shown in Fig. 11. The damping ratio varies in a wide range in both the and direction. It may be attributed to the influence of aerodynamic damping due to nonrectangular cross-section of the building. In some special wind directions, the aerodynamic damping ratio may be negtive. Therefore, the total damping ratios under those wind directions, for instance the wind direction of 60° and 90°, are very small and even close to zero.
Fig. 11Identified dynamic parameters of the model-balance system of GZET
a) Natural frequency
b) Damping ratio
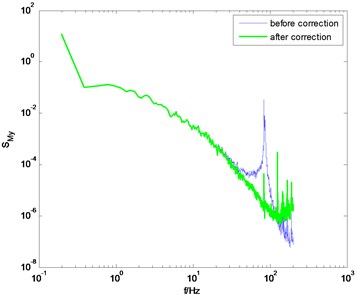
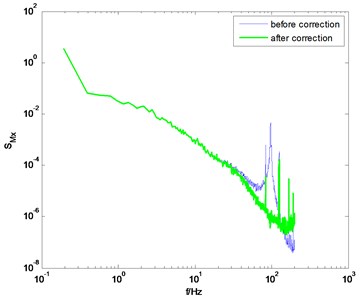
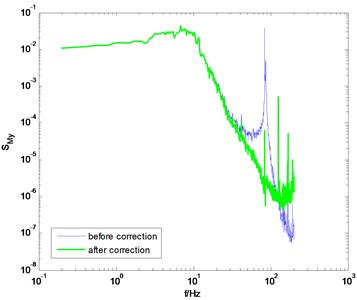
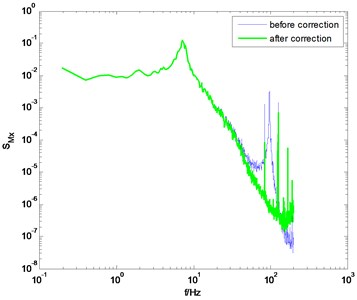
Fig. 12 shows the PSD of the overturning moments and after correction under the wind direction of 0° and 90°. The PSD before correction is also presented for comparison. It can be seen that the amplification cause by the model-balance system in the high frequency band is eliminated effectively, thus verifying the correctness of the proposed method. The aforementioned three examples also show that the assumption shown in Eq. (9) is reasonable. That is, in a specific frequency range in the high frequency band, the PSD of overturning moment is linear with the frequency in double logarithm coordinate.
4. Conclusions
The methodology for identification of the natural frequency and damping ratio of model-balance system in HFFB wind tunnel tests is presented. This method is capable of identifying the natural frequency and damping ratio of a model-balance system without additional knocking tests. Base on the assumption that the PSD of the overturning moment as the base of the model be linear with the frequency in double logarithm coordinate, the natural frequency and damping ratio of the model-balance system can be identified directly using the wind tunnel test data. Unlike results obtained through knocking tests, using the proposed method in this study, the identified damping ratio of the model-balance system usually changes with wind directions. It contains not only the structural damping but also the aerodynamic damping of the model-balance system. Compared to the conventional knocking method, the proposed method is easy implemented and more accurate in identification of dynamic parameters of a model-balance system in wind tunnel tests. Three examples are presented to illustrate the applications and effectiveness of the proposed method, and it is found that the obtained PSD after correction is quite satisfactory. Overall, the approach provides an easily implemented and more accurate new way to determine dynamic parameters of model-balance system in wind tunnel tests.
Fig. 12PSD of overturning moments of GZET before and after correction using the proposed method
a) direction, 0° wind angle
b) direction, 0° wind angle
c) direction, 90° wind angle
d) direction, 90° wind angle
References
-
Tschanz T., Davenport A. G. The base balance technique for the determination of dynamic wind loads. Journal of Wind Engineering and Aerodynamics, Vol. 13, 1983, p. 429-439.
-
Xie J., Irwin P. Application of the force balance technique to a building complex. Journal of Wind Engineering and Aerodynamics, Vol. 77, Issue 8, 1998, p. 579-590.
-
Bernardini E., Spence S. M. J., Kareem A. A probabilistic approach for the full response estimation of tall buildings with 3D modes using the HFFB. Structure Safety, Vol. 44, 2013, p. 91-101.
-
Bernardini E., Spence S. M. J., Gioffre M. Effects of the aerodynamic uncertainties in HFFB loading schemes on the response of tall buildings with coupled dynamic modes. Engineering Structures, Vol. 42, 2012, p. 329-341.
-
Spence S. M. J., Bernardini E., Gioffre M. Influence of the wind load correlation on the estimation of the generalized forces for 3D coupled tall buildings. Journal of Wind Engineering and Industrial Aerodynamics, Vol. 99, 2011, p. 757-766.
-
Lam K. M., Li A. Model shape correction for wind-induced dynamic responses of tall building using time-domain computation and wind tunnel tests. Journal of Sound and Vibration, Vol. 322, 2009, p. 740-755.
-
Xie Z. N., Gu M. Simplified formulas for evaluation of wind-induced interference effects among three tall buildings. Journal of Wind Engineering and Aerodynamics, Vol. 95, 2007, p. 31-52
-
Cluni F., Gusella V., Spence S. M. J., Bartoli G. Wind action on regular and irregular tall buildings: higher order moment statistical analysis by HFFB and SMPSS measurements. Journal of Wind Engineering and Aerodynamics, Vol. 99, 2011, p. 682-690.
-
Tschanz T., Davenport A. G. The base balance technique for the determination of dynamic wind loads. Journal of Wind Engineering and Industrial Aerodynamics, Vol. 13, 1983, p. 429-439.
-
Zhao X. Ding J. M., Suna H. H. Structural design of Shanghai Tower for wind loads. Procedia Engineering, Vol. 14, 2011, p. 1759-1767.
-
Chan C. M., Huang M. F., Kwok K. C. S. Integrated wind load analysis and stiffness optimization of tall buildings with 3D modes. Engineering Structures, Vol. 32, Issue 5, 2010, p. 1252-1261.
-
Xie J. M., Garber J. HFFB technique and its validation studies. Wind and Structures, Vol. 18, Issue 4, 2014, p. 375-389
-
Holmes J. D. Mode shape corrections for dynamic response to wind. Engineering Structures, Vol. 9, 1987, p. 210-212.
-
Bernardini E., Spence S. M. J., Seymour M. J., Kareem A. A probabilistic approach for the full response estimation of tall buildings with 3D modes using the HFFB. Structure Safety, Vol. 44, 2013, p. 91-101.
-
Chen X. Z., Kareem A. Validity of wind load distribution based on high frequency force balance measurements. Journal of Structural Engineering-ASCE, Vol. 131, 2005, p. 984-987.
About this article
The work described in this paper is fully supported by grants from the National Science Foundation of China (51278204, 51208127, 51478130), the Natural Science Foundation of Guangdong Province, China (S2012010009831) and the Project of Science and Technology of Guangzhou, China (2014J4100141). The financial supports are gratefully acknowledged.
