Abstract
The report presents an analysis of the influence of body structure on the propagation of vertical vibration in selected regions of a seated human body. The first part of this paper describes the experiment, paying particular attention to the conditions of the study and the variation of anthropometric features of the participants of the experiment. The second section discusses the results of the experimental simulation with particular emphasis on the relationship between selected values characterizing dynamic properties and basic anthropometric parameters of the human body.
1. Introduction
A vehicle that meets vibrational comfort requirements should be equipped with an appropriate body suspension, cab, and seat. The seat should be adjustable to match the individual characteristics of drivers. This task is made difficult by the differentiation between individual dynamic and particularly anthropometric characteristics of drivers. The term anthropometric characteristics should be understood as, among other things, height, weight, and measurable anatomic characteristics of the human body, which characterize the positioning of the spine, etc. It should be noted that anthropometric characteristics the general population (women and men) of adults have a very wide range, which consequently translates into needing to the adjust parameters of car seat suspensions. Because of that, this report attempts to demonstrate the connection between selected indicators of dynamic property and the fundamental human anthropometric traits.
1.1. Procedure
Studies were carried out on adults, whose basic anthropometric measurements were the basis for the result analysis.
Each of the participants was examined on a backed seat, on which they seated themselves comfortably in order to minimize the weight on their back, abdominal, pelvic, and thigh muscles. A comfortable position, which was possible thanks to adjusting the back, seat, and footrest, allowed for only slight muscle tension and eliminated pressure on internal organs such as the stomach.
Prior to the start of the study, each person had trial runs in order accustom them to behave passively and assume a specific posture relative to the seat during the whole research process.
During the course of the study, acceleration was recorded in four regions of the driver’s body along with the seat surface, which comprised the test system.
During the tests an inductor (electro-hydraulic pulsator) generated sinusoidal oscillations in a frequency range from 1 to 20 Hz, typical for vibrational comfort analysis in vehicles [1]. Based on literature [2, 3], and pilot studies, frequency intervals were decreased in ranges in which the human body has a large variation in dynamic characteristics. The research was carried out for the following frequencies: 1 Hz, 2 Hz, 2 Hz to 4 Hz every 0.2 Hz, 4 Hz to 10 Hz every 0.25 Hz, and 10 Hz to 20 Hz every 1 Hz, with a maximum acceleration amplitude of 0.25 g [2, 4]. In the course of the study, vertical acceleration was recorded in the head, chest, abdominal regions and seat surface, using sensors mounted on a helmet, mouthpiece, special belts, and an elastic rubber measurement disc.
The participants of the study were characterized by measuring anthropometric quantities such as height, weight, head, chest, and abdomen circumference and torso length. These quantities made it possible to calculate each person's BMI (Body Mass Index), which was used as a guide when categorizing participants as representative of people with a proper weight indicator, overweight, or underweight.
1.2. Analysis of the characteristics of participants’ transmittance modes
Based on the recorded acceleration runs, transmittance functions were computed for each participant, which describe the propagation of vertical vibration in bodies of the participants. Characteristics of the transmittance modes of each region of the participants' bodies are shown in Fig. 1.
Fig. 1Transmittance between thorax and seat [5]
![Transmittance between thorax and seat [5]](https://static-01.extrica.com/articles/15597/15597-img1.jpg)
There are many normal modes in systems with multiple degrees of freedom. The strongest amplification occurs for lower frequency vibrations. For higher frequencies, vibration in most systems (including the human body) is suppressed enough that successive resonance peaks are less and less visible, and some are not even experimentally observable. For example, if there are two resonant frequencies close together, they often combine into one peak on graphs, covering a wide frequency range. Among the characteristics of the human body, the first resonant peak exhibits relatively large repeatability (in both the abscissa and ordinate). The second peak is much less pronounced, and is difficult to notice in some participants’ results. In particular there is a strong variation in abdomen – seat transmittance. Therefore, it was decided to base the comparative analysis on the first resonance peaks. Both resonance frequency value (abscissa) and ordinate value (the value of the maximum gain) were compared.
The first resonance frequency occurs in a different frequency range for each of the analyzed body regions. More than 80 % of the participants exhibited a first resonance frequency in the head within a range of 4 to 5 Hz, of which nearly 50 % of the people had observed resonance frequencies between 4.5 and 4.75 Hz (Fig. 2). It should be noted, however, that for certain participants, the resonance frequency differs significantly from the ranges above. In general, this resonance was recorded in the range from 3.2 to 11 Hz, as shown in Figure 2(a). For 84 % of the participants, the first resonance frequency of the chest was in the range from 4.5 to 5.5 Hz. For the largest group, which included more than 24 % of the participants, the first resonance frequency registered on the chest was 4.75 Hz. It should be noted, however, that for certain participants, the resonance frequency differs significantly from the ranges above. In general, this resonance occurred in the recordings in the range from 4 to 6.75 Hz which is illustrated in Fig. 2(b). For 77 % of the participants, the first resonance frequency of the abdomen are in the range from 4.75 to 6.75 Hz. For the largest group, which represents more than 21 % of the participants, the first abdominal resonance frequency was recorded at 5.5 Hz. It should be noted, however, that for certain participants, the resonance frequency differs significantly from the ranges above. In general, this resonance was evident in the range from 3.40 to 9.50 Hz, which is illustrated in Fig. 2(c).
Fig. 2Distribution of the first resonance frequency
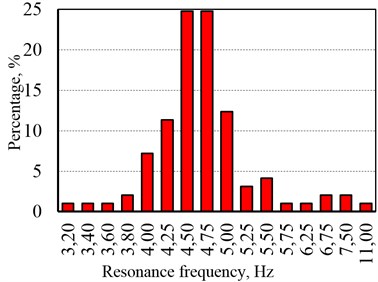
a) Head
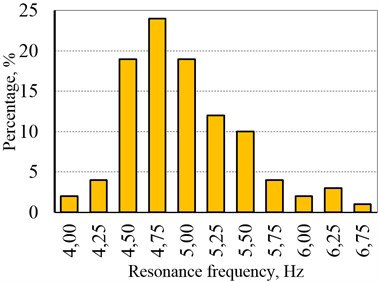
b) Chest
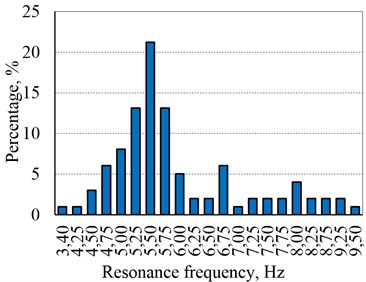
c) Abdomen
The values of the measured amplitudes of the first resonant frequencies in the selected frequency ranges are shown in Fig. 3. The maximum range of variation in the amplitudes for the head and chest is more than 47 %, and over 56 % of the maximum gain in the resonance frequency in the abdomen.
The first resonant frequency and the amplitude at that frequency were used as values describing the dyamic properties of the human body.
These dynamic properties were then analyzed for correlation with anthropometrie traits (body weight, height, abdominal and chest circumference).
Examples of the relationships between the measured characteristics are shown in Figure 4, and a summary of correlation coefficients in Table 1.
The correlation analysis was done according to I. P. Guiford [6].
Fig. 3Ranges of variation in the acceleration amplifications
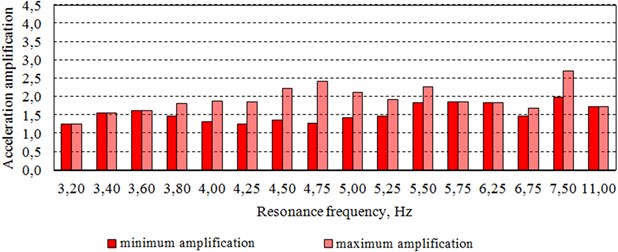
a) Head over a frequency range 3,2-11 Hz
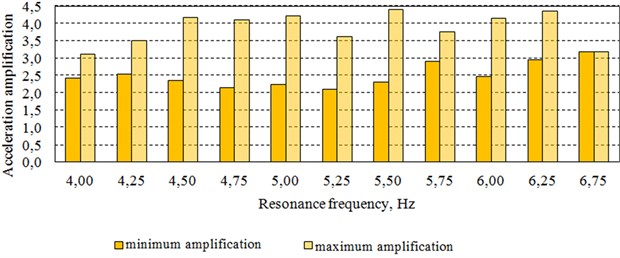
b) Chest over a frequency range 4-6,75 Hz
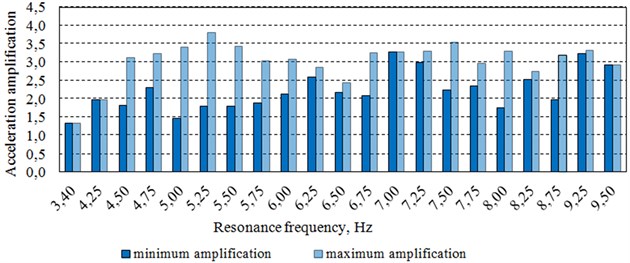
c) Belly over a frequency range 3,4-9,5 Hz
Fig. 4Relationship between the chest acceleration amplification in the first resonance frequency fk01 and two anthropometric parameters (weight, chest circumference)
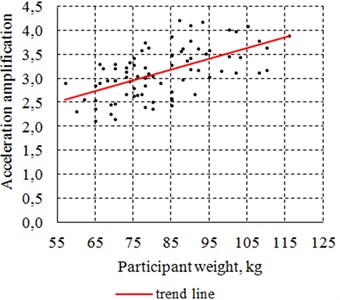
a) Participant weight
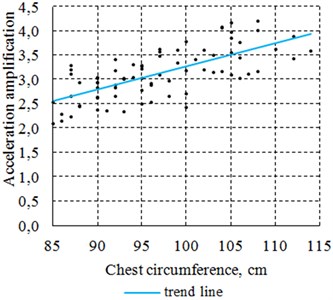
b) Participant chest circumference
Table 1Correlation between anthropometric human traits and quantities describing the spread of vibration in the human body
Anthropometric characteristics of participants | |||||
Body weight | Height | Abdominal circumference | Chest circumference | ||
Acceleration amplification at the first resonance frequency | Head, | –0.02* | –0.01* | –0.004* | –0.08* |
Chest, | 0.58*** | 0.53*** | 0.53*** | 0.7 (0.703)**** | |
Abdomen, | 0.47*** | 0.14* | 0.52*** | 0.38** | |
* – A correlation coefficient below 0,2 signifies weak correlation, and the dependence is irrelevant; ** – A correlation coefficient > 0.2 and < 0,4 signifies low correlation, and the dependence clear but small; *** – A correlation coefficient > 0.4 and < 0.7 signifies moderate correlation, and the dependence is substantial; ****– A correlation coefficient > 0.7 and < 0.9 signifies strong correlation, and the dependence is significant; ***** – A correlation coefficient > 0.9 and <= 1.0 signifies a very high correlation, and the dependence is very certain. | |||||
2. Conclusions
The study confirmed the large diversity of human dynamic properties often found in literature. The anthropometric characteristics of the participants are one of the main reasons for this diversity.
Based on the correlation graphs and analysis it was concluded that:
1) The analyzed anthropometric characteristics did not appear to influence the amplitude of the first resonance frequency of the head.
2) Body weight and abdominal circumference, to varying degrees, both had a significant impact on the amplitude of the first resonance frequency of the abdomen.
3) Body weight, height, and abdominal circumference all had a significant impact on the amplitude of first resonance frequency of the chest.
4) The highest correlation of 0.7 was observed between chest circumference and the magnitude of the first resonance frequency of the chest.
References
-
ISO 5982:2001 Mechanical vibration and shock – Range of idealized values to characterize seated – body biodynamic response under vertical vibration.
-
Książek M. Modelling and optimization of the system of the human body – vibration isolator – machine. Monografia No. 244, Seria Mechanika, Wyd. Politechniki Krakowskiej, Kraków, 1999, (in Polish).
-
Smith S. D., Smith J. A., Bowden D. R. Transmission characteristics of suspension seats in multi-axis vibration environments. International Journal of Industrial Ergonomics, Vol. 38, 2008.
-
Smith S. D. Resonance behavior of the human exposed to whole-body vibration. United Kingdom Group on Human Response to Vibration, Southampton, 1992, (in Polish).
-
Zuska A. Modeling and analysis of the dynamics of seat – driver systems. Doctoral thesis, Kielce University of Technology, Kielce, 2012.
-
Mończak K. Experiment Planning Techniques. WNT, Warszawa, 1976, (in Polish).
About this article
