Abstract
The application of contactless and non-destructive methods of measurements and analyses of vibroacoustic signals to evaluate the degradation of composite materials during their bending is proposed in the paper. Stand tests of bending of composite samples based on simultaneous recording of the stress – deflection characteristics were carried out and measurements were performed of their instantaneous vibration velocity and acoustic pressure in their vicinity. Samples of glass- and jute-fibre reinforced polymer (FRP) laminates were subjected to examination. The obtained results have shown that the measurements of vibration and acoustic pressure expand and supplement the mechanical tests, and enable observation of the momentary destructive changes in the investigated materials. It was found that an instantaneous change of signals amplitude corresponds to the occurrence of local failure in the composite material. Spectral analysis of vibration velocity and acoustic pressure signals allowed a selection of the frequency bands in which symptoms of failure occurring in the composite material can be observed. The tests have also shown that the thresholds of point characteristics determined on the basis of the recorded vibration and noise signals may be used as indicators of the beginning of composite material’s degradation when it is loaded.
1. Introduction
Fibre reinforced polymer (FRP) composites, often called ‘laminates’, are more and more commonly used in the construction of means of transport and for other applications [1-5]. The determination of their mechanical properties and forecasting of their durability require appropriate stand tests and simulation experiments [6-9]. The obtained results facilitate optimizing the structure and manufacturing process, and enable application of new solutions [1, 3, 5, 10-12].
One of vital issues concerning laminates is the manner of their destruction (failure initiation and progress). Due to the structural complexity, it is very specific. The nature of destruction depends on the type and arrangement of the reinforcing fibres [13]. Glass fibre is currently the main type of reinforcement used in laminates. It is a very resistant material with quite a large modulus of elasticity and, at the same time, relatively cheap. Glass fibre composites exhibit a high potential for the designing of their structure and properties [6, 7]. However, recycling of such composition (polymer and glass) is a significant problem. Therefore, natural vegetal fibres have become an alternative for glass. Currently, numerous research works aim at substituting natural fibres for glass fibres in a certain range of applications. Such research is focused on searching for chemical and/or physical modification of the fibres in order to improve wettability and mechanical properties [8, 10-12]. Observations confirmed a “gentler” progress of failure of laminates based on natural vegetal fibres, compared to glass reinforced ones, which is their another advantage.
Studies concerning the detection of failure and cracking of composites used for rotor beams, plates and structures, were presented, inter alia, in papers [13-21]. They proposed to take advantage of an analysis of mechanical curves, acoustic signal emission, tomography or local changes in resistance. Basically, the applied methods consist in recording an appropriate signal which comes from the cracking of the matrix (delamination, cracking inside fibre bands) or from the cracking of fibres. It is possible, because these components differ a lot in their elasticity module. Thus, all signals induced by elastic waves (acoustic, mechanical, a local change in the temperature or resistance) and coming from the destruction of these two components will differ in their energy and frequency. Each of the methods has its advantages and disadvantages, and therefore, efforts are constantly being made to introduce new diagnostic solutions.
One of the practicable methods during diagnostic studies concerning the detection of failure and cracking of composites is the measurement and processing of vibroacoustic signals. Based on the noise and vibration signals of the examined components, recorded at a frequency of several dozen kHz, it is possible to evaluate e.g. the technical condition, while taking into account the instantaneous changes in the amplitude and frequency. Signal processing is an essential element of vibroacoustic studies, as were presented inter alia, in papers [22-48]. Numerous research is conducted in this field to develop the existing signal processing methods and use them for new applications. Methods of measurements and analysis of vibration and noise signals have been successfully applied for years to detect early cases of failure of complex movable systems [22-39], and to forecast the development of failure [22, 30, 35] or to plan the operation of mechanical systems, e.g. motor vehicle drives [28, 41, 45].
The methodology of measurement and processing of vibration and noise signals can be used for analysis of material behavior during static mechanical tests, such as: bending, tension, torsion, compression or shearing. Such tests consist in discret registration of load – displacement relation as a set of points. They are most often carried out at a low sampling frequency of maximum several dozen Hertz, which may lead to “losing” in the tests of certain significant changes that are taking place in the composite material under loading. In the tests it is not possible to take account of the momentary change in the material’s stress level between the recording points. In such cases, vibration and noise measurements taken at a high sampling frequency may facilitate evaluation of the quickly changing destructive phenomena which occur in the investigated composite.
The paper presents the results of preliminary test stand experiments whose purpose was to evaluate the three-point bending of composite samples based on simultaneous recording of their load (stress) – displacement (deflection) characteristics, and the instantaneous velocity of their vibration, and the level of acoustic pressure (noise signal) near the samples. Usefulness of the proposed recording and processing methods of vibration and noise signals in the evaluation of the condition of composites was proved using composite samples of two types, made of glass- and jute-FRP laminates. The paper also presents an assessment of the characteristics of stress changes in the material of the samples with progressive deflection, and the accompanying instantaneous changes in the vibration velocity and the acoustic pressure level. A spectral analysis of vibration and noise signals was made to allow selecting the frequency bands in which symptoms of failure occurring in the examined material is observed. Also, calculations of point characteristics of the vibration and noise signals were made in order to assess the possibility of using them in an analysis of the composite material’s degradation.
2. Research materials
Samples of two composite types were used in the research. The first type (hereafter: “composite I”) was reinforced with 6 layers of lightly twisted jute yarn (for application in technical fabrics) with plain weave and grammage of 350 g/m2 – in total: 2100 g/m2. Manufacturer: LENTEX, Poland. The other type (hereafter: “composite II”) was reinforced with glass roving fabric (E-glass) with plain weave and the same grammage of 350 g/m2 – in total: 2100 g/m2. Manufacturer: KROSGLASS, Poland.
The applied fibres differ significantly in their elasticity module. The modulus of the jute fibres used is ca. 7 GPa and is almost comparable to the modulus of the matrix made of duroplastic polymer (modulus of ca. 3-5 GPa), while the modulus of the glass fibres is in the order of 73-75 GPa (E-glass), and differs by 15-20 times compared to the matrix. The difference in the module is very important in terms of the elastic reaction of the particular components and the occurring acoustic [13] and vibration signal.
The matrix used was made of polyester resin, ESTROMAL 14 LM (styrene content of ca. 25 %) produced by ERG PUSTKOW, Poland. It was hardened with a 25 % solution of methyl ethyl ketone peroxide in dimethyl phthalate (LUPEROX). Saturation of piles of fabrics (preforms) with dimensions of 250×350 mm was performed using the vacuum infusion method in a one-direction flow system at a static pressure gradient of 0.9 bar. The hardening of the resin was performed in a vacuum at room temperature, with after-bake at 60°C for 6 h. The obtained laminate plates were of good visual quality, with the fibres’ volume fractions of 52 % for the glass and 42 % for the jute. Thickness of the glass fibre reinforced laminates was ca. 2 mm and of those with jute, ca. 5 mm. The authors are well experienced in fabricating laminates using pressure methods [6-8, 10-13]. The samples for tests were cut out of the plates mechanically, by means of a rotation cutter.
3. Testing procedure and the signal processing method
Static three-point bending tests were conducted on the INSTRON 4469 strength testing machine, which had been additionally equipped with a vibration and noise measurement system. The diagram of the entire measuring device is shown in Fig. 1.
Fig. 1Measuring device diagram: 1 – device housing, 2 – supports, 3 – test piece, 4 – moveable traverse with force measuring head, 5 – load-imposing mandrel, 6 – laser vibrometer, 7 – microphone of noise analyser
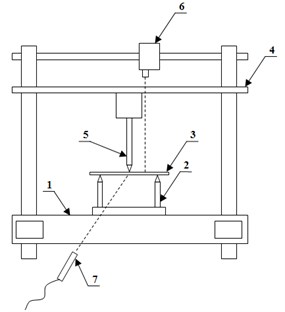
The tests were conducted in accordance with the PN-EN-ISO 14125/2001 standard. A constant support spacing - specimen thickness ratio of 25/1 was ensured. A constant deformation rate of 60 mm/min was adopted. Relatively high speed (short test duration) allowed for acquisition of high-resolution data from vibroacoustic measurements. The deflection and load values were recorded at the sampling frequency 10 Hz. Bending tests were performed on 5 test pieces of each laminate. The initial analysis allowed the conclusion that the course of the characteristics of individual test pieces in both groups is very similar. In view of this, in order to achieve transparency of the presented argument, only 1 representative test piece from each group was selected for the vibration and noise signals analysis. Test pieces in which the maximum stress was the closest to the average value for the given population were selected.
The measurement system was equipped with the OMETRON laser vibrometer, which is used for contactless measurements of the test piece vibration velocity. The laser beam is located in such a way that composite vibrations are measured halfway between the point where the test piece is initially supported and the point where the loading bar initially touches the piece. At the same time, the momentary acoustic pressure level was recorded in a distance of 0.5 m from the measured sample by means of a Bruel & Kjear 2250 signal analyser.
The vibration velocity of the test pieces and the momentary acoustic pressure level were recorded at a sampling frequency of 20 kHz. The NI data acquisition card and LabView software was used to record the data and Matlab-Simulink software was used to process signals. Signal recording and tests were conducted until the test pieces clearly broke.
4. Results and analysis
The conducted bending tests made it possible to obtain the stress – deflection characteristics of the materials. Curves obtained for both composites are shown in Fig. 2. The determined flexural strength and the deformation of the external layers corresponding to the maximum stress are shown in Table 1.
Fig. 2Bending curves for the examined laminates
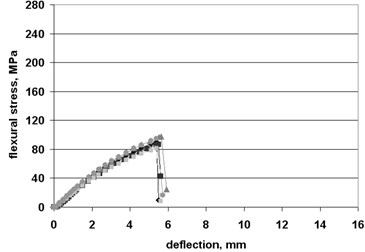
a) Jute fibre reinforced laminate (composite I)
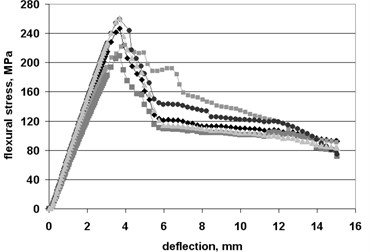
b) Glass fibre reinforced laminate (composite II)
Bending results with the superimposed vibration and acoustic pressure signals for composite I – jute fibre reinforced laminate – are shown in Figs. 3 and 4.
As expected, as the test piece deflection increases, stress in the examined material increases almost linearly until it breaks. The minor deviation from linearity is caused by two effects: viscoelastic behaviour of the polymer matrix (reversible relaxation caused by the breaking of van der Waals bonds under the influence of mainly shearing stresses) and the relaxation of twisted strands of the jute yarn forced by the load. The second effect has already been analysed by the authors [10]. The maximum recorded value of the stress is 90 MPa at a test piece deflection of 5.3 mm. The course of the change in the stress as the deflection increases does not indicate any noticeable local fluctuation.
Table 1Flexural strength and the corresponding deformation for the examined laminates
Material | Flexural strength, MPa | Deformation of the specimen external layers, corresponding to the maximum stress, % |
Jute fibre reinforced laminate (composite I) | 90±6 | 2.6±0.04 |
Galss fibre reinforced laminate (composite II) | 239±20 | 1.8±0.05 |
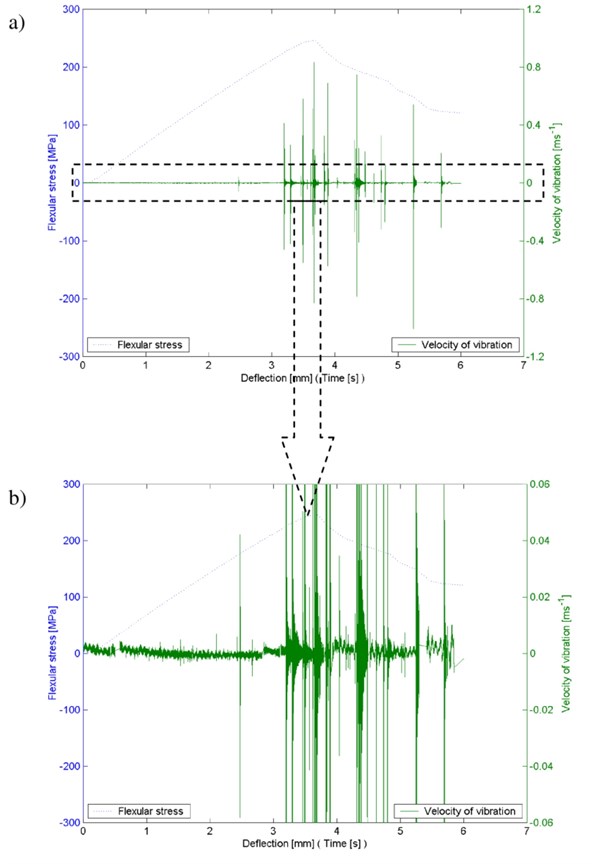
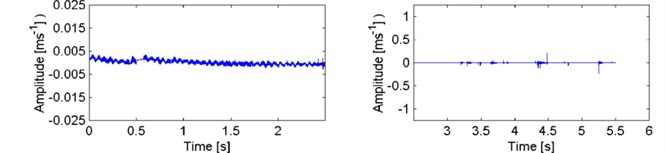
The simultaneously taken measurement of the test piece vibration velocity demonstrated that minor local increases in the vibration amplitude of a value below 0.035 ms-1 occur until the test piece breaks. As the test piece deflection increases beyond 2.9 mm (stress above 60 MPa), the frequency of the occurrence of local increases in the signal amplitude is observed, which probably means that that the material was damaged. Taking into account the lack of fluctuation of the recorded force (it would be present if the reinforcing structure of the material was significantly damaged), a supposition should be made that the vibration is caused by the breaking of individual elementary fibres inside the yarn strands in the stretched section of the test piece or by the breaking of the resin, mainly due to shearing in interlaminar areas. The second effect has already been observed by the authors in the previous research [13]. This signal is also too distinct to be caused by the friction on supports (or against the loading bar). It is clearly visible on Fig. 3 that the intensity of this signal grows as the deflection increases.
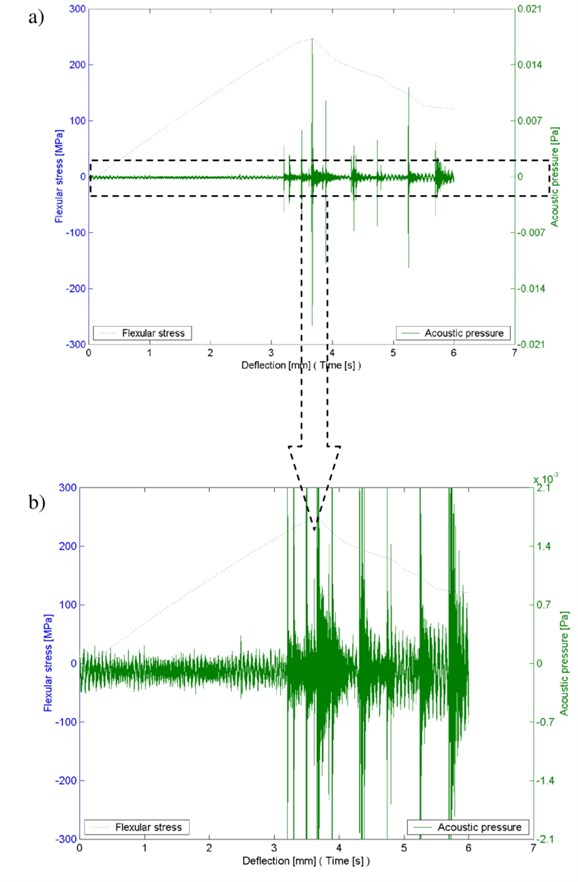
Fig. 3Characteristics of the change in the stress and vibration during the bending test of the composite I (jute) test piece: a) full course, b) magnified fragment
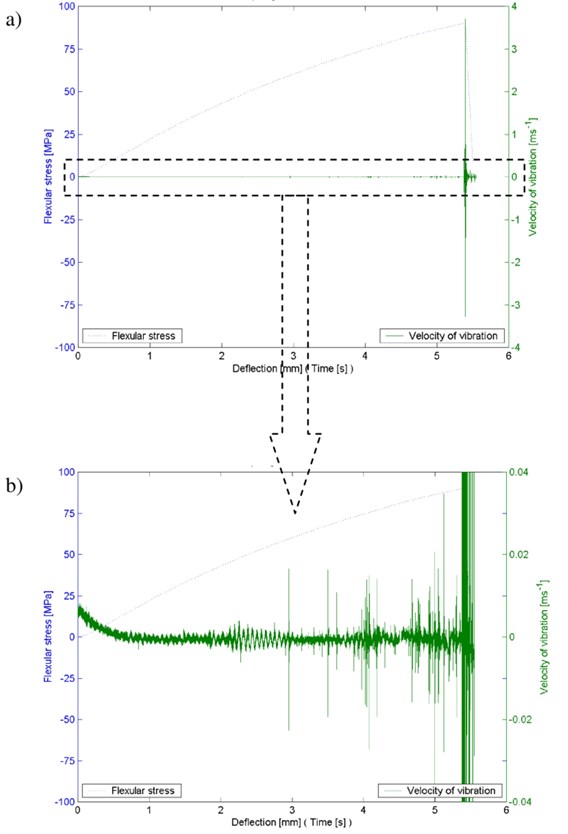
In the test piece deflection range above 5.3 mm, when the value of tension in the composite is approximately 90 MPa, a single rapid increase in the vibration signal amplitude of a value of approximately 3.6 ms-1 occurs, accompanying the test piece fracture. Taking into account the nature of the fracture (shown in Fig. 5(a)), this signal is caused by the breaking of both the reinforcing fibres and the matrix. The test piece is broken without distinct delamination near the fracture.
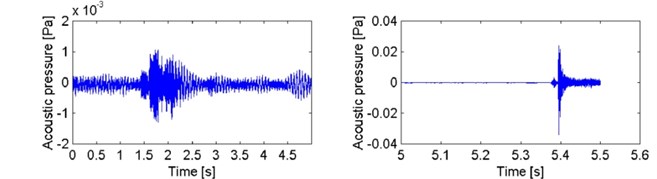
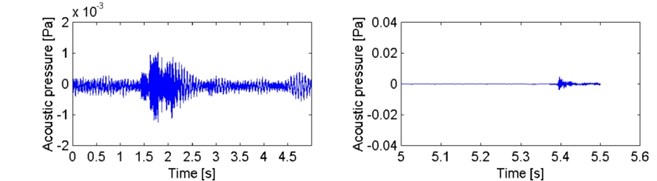
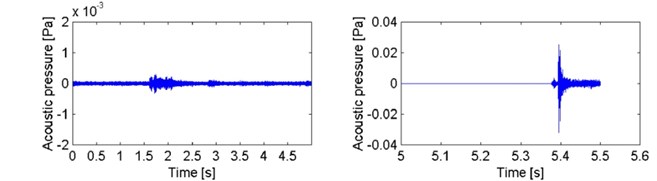
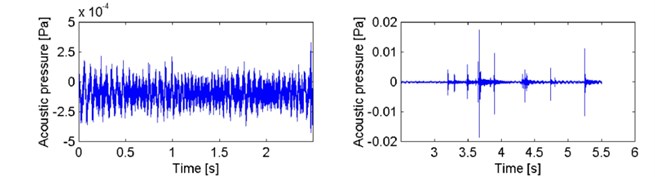
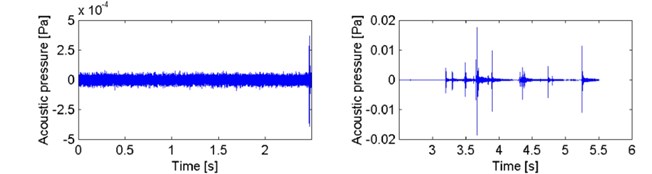
Measurements of the momentary acoustic pressure level during bending of composite I sample within the range up to 5.3 mm, i.e. before the beginning of a distinct fracture of the sample (Fig. 4), showed their lower diagnostic usefulness for detecting degradation in the jute fibre reinforced laminate compared to the vibration measurements made. This is connected with the low vibration amplitude value during the initiation of failure in the investigated composite compared to the value of this amplitude during its cracking. As results from Fig. 3, the difference in the values of the sample’s vibration amplitudes before and during cracking reaches 100 times. This probably results from the relatively small modulus of the jute fibre, which is related to its not very rapid breaking. This, in turn, results in low speeds of local dislocations of the cracking material, which generate waves of acoustic pressure. However, a proper “mass scale” of the destruction of fibres is connected with the cumulation of energy sufficient to generate quite strong vibration of the sample.
Fig. 4Characteristics of the change in the stress and acoustic pressure during the bending test of composite I (jute) test piece: a) full course, b) magnified fragment
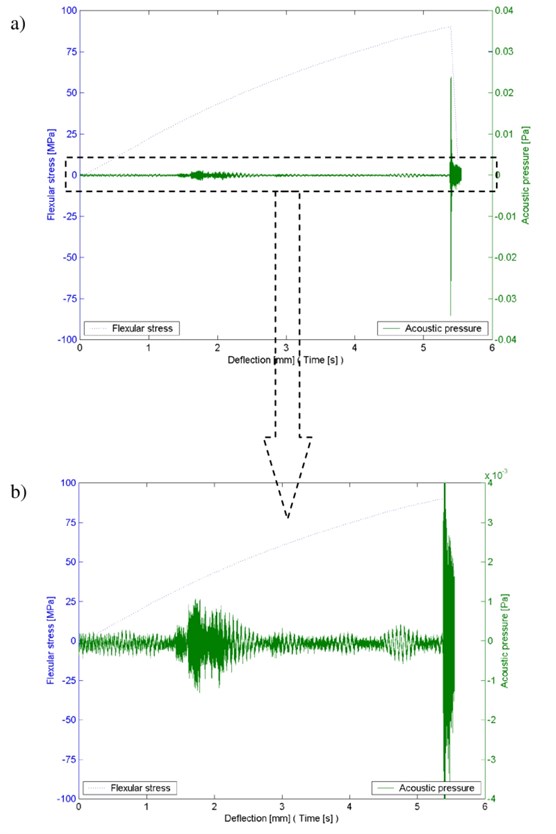
Recording of signals of the momentary acoustic pressure level proved useful in the case of bending samples made of composite I within the range of their fracture (Fig. 4). Based on this level it is possible to unequivocally identify the beginning of fracture of a jute cloth reinforced laminate sample.
The results of vibration and noise measurements have corroborated the utilitarian aspect of the methods proposed in the paper, i.e. measurement of the vibration velocity by means of a laser vibrometer and measurement of the acoustic pressure near the test piece, for the detection of degradational changes in the composite material during its bending. It can be noted that in the case of composite I – jute cloth reinforced laminate – the measurement of vibration enables observation of the progressing degradation earlier than when measuring noise.
Fig. 5Photographs of representative test pieces of the examined laminates after bending tests
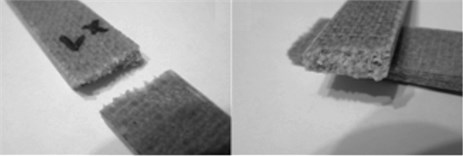
a) Jute cloth reinforced laminate (composite I)
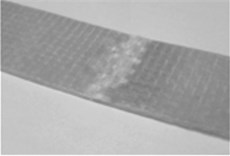
b) Glass fibre reinforced laminate (composite II)
In the further part of the study a spectral analysis of the recorded vibration and noise signals was made to evaluate the frequency changes in the signals, caused by damage in composite I. Short-time spectra of the signals of the vibration velocity and acoustic pressure of the composite material I test piece are shown in Figs. 6 and 7. A signal length of 0.5 s (10000 samples) was adopted in calculations when determining the fast Fourier transform (fft).
Fig. 6Short-time spectra of the vibration signal – composite test piece I
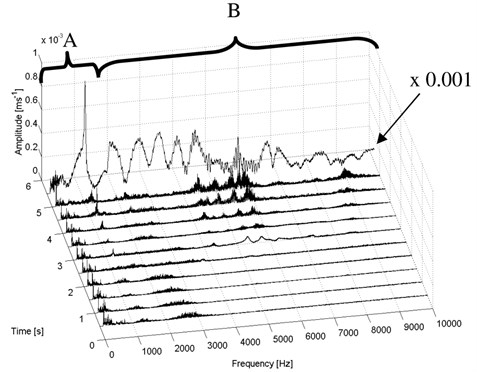
The results of these calculations indicate that as the vibration signal amplitude locally increases at the test piece deflection of 5 mm (5 s), an increase in the amplitude of its fft distributions is observed in the range of frequency bands from 4.0 to 6.5 kHz and above 8 kHz. Calculations conducted for deflection beyond 5 mm indicated a significant increase in the vibration amplitude in the entire frequency range, characterised by non-regular local maxima.
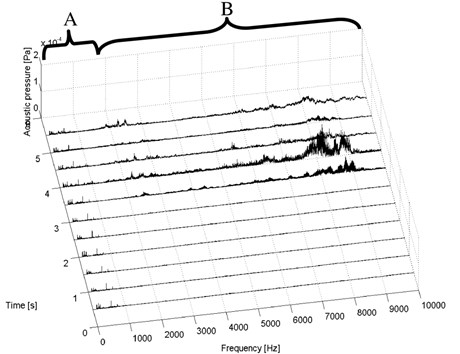
Short-time fft spectra of the acoustic signal corroborated the possibility of using the signal to detect the moment of fracture of a composite sample made of jute cloth reinforced laminate. During deflection of the sample, within the range of which fracture of the examined composite material is observed, a broadband increase of the amplitude of sound is observed in the spectrum above 1.0 kHz, with local maxima of ca. 4.5 kHz, 6.2 kHz and 7, and 7.8 kHz.
Band filtration of the vibration signal and the acoustic pressure signal was conducted in order to identify its frequency ranges which may contain information on damage present in the examined test piece before its fracture. Filtration of signals conducted in the initial tests using low-, high- and band-pass filters made it possible to select two characteristic frequency bands of the vibration signal and the acoustic pressure signal of the composite I test piece. The first band designated A comprises the 0-1800 Hz frequency range which does not contain symptoms of damage to the composite. The second band designated B comprises the 1800-10000 Hz frequency range which contains symptoms of damage to the composite which occurred during bending. The test piece vibration velocity signal and the acoustic pressure signal in various frequency band ranges is shown in Figs. 8 and 9.
Fig. 7Short-time spectra of the acoustic pressure signal – composite test piece I
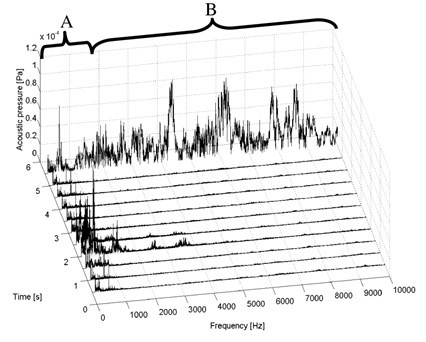
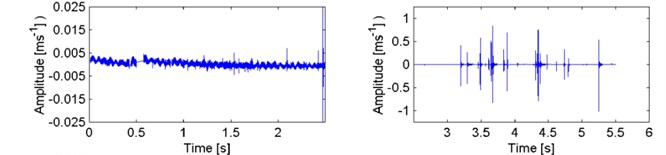
Fig. 8Vibration velocity signal recorded during tests of composite test piece I (jute)
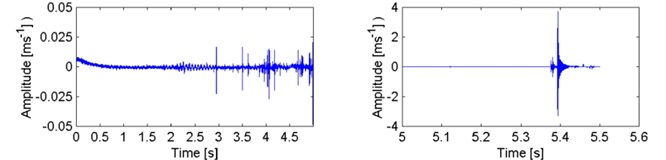
a) Frequency range 0 – 10000 Hz
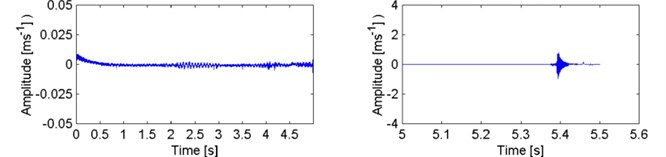
b) Frequency range 0 – 1800 Hz
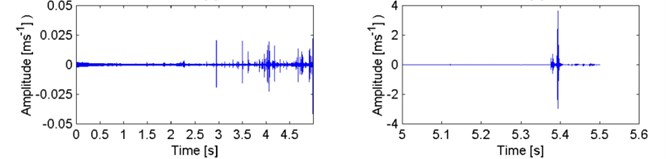
c) Frequency range 1800 – 10000 Hz
Test piece vibration velocity and the acoustic pressure results confirm that the signals spectrum selection was correct. The signals after low-pass filtration contains a minor part of the amplitude present only at the time the test piece broke. The remaining constituents of the signal, occurring as a result of damage to the composite, are contained in high-frequency components of the spectrum.
Fig. 9Acoustic pressure signal recorded during tests of composite test piece I (jute)
a) Frequency range 0 – 10000 Hz
b) Frequency range 0 – 1800 Hz
c) Frequency range 1800 – 10000 Hz
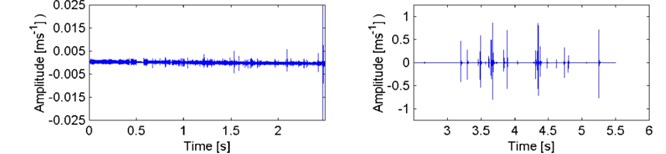
In the further part of the paper, the results of examination and analysis of composite II – glass fibre reinforced laminate – are presented. The characteristics of the change in stress and vibration and the acoustic pressure signals of composite II test piece (glass) are shown in Figs. 10 and 11.
Just like in the case of the jute-laminate specimens, a test pieces made from the laminate with glass fibres are characterised by almost linear stress increase. However, the course in this case is much more similar to a linear course than in the case of the former laminate. Non-linearity is in this case caused mainly by viscoelastic behaviour of the polymer matrix.
Measurements of the vibration of composite II test piece demonstrated that a minor increase in the signal amplitude can be observed from the very beginning of the bending test. Taking into account a much bigger elasticity modulus of glass fibres (more than 70 GPa) compared to jute fibres, this is probably related to local effects of the shift of glass segments (conformational motions), which accompanies effort. Additional effects probably appear at further deformation stages (from approximately 2.4 mm) in the form of the breaking of elementary fibres and the matrix in interlayer areas. The second effect in particular has been examined using acoustic emission as part of the authors’ previous research [13]. As the test piece deflection increases beyond 3 mm, further increases in the signal amplitude with a significant value of up to 0.83 ms-1 are observed. These increases accompany the test piece breaking process, which at some point is manifested by a significant decrease in the stress value on the curve. However, it should be emphasised that intensive changes in the vibration signal amplitude (deflection of approximately 3.1 mm) start at a point clearly preceding the point when the test piece failure begins, which is visible on the mechanical curve (approximately 3.3 mm). This is a very important observation, also from the technical point of view – safe deflection of the laminate (equivalent of the yield point in metals) certainly should not exceed 3 mm in the examined case. After the test piece has been broken (the maximum stress is exceeded on the curve), further local amplitude increases can be observed in the vibration signal. These increases correspond to the simultaneous processes of gradual breaking of fibres and delamination. This is evidenced by the photograph of the test piece after bending – Fig. 5(b). The maximum value of stress of the examined test piece is 248 MPa, and there was a 3.7 mm deflection when it broke.
Fig. 10Characteristics of the change in the stress and vibration during the bending test of the composite II (glass) test piece: a) full course, b) magnified fragment
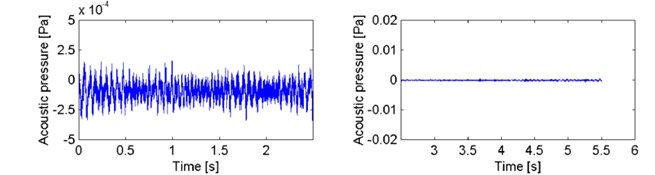
The simultaneous measurement of the signal of the momentary acoustic pressure level conducted in that case shows that the level increases as destructive changes occur in composite II. The local increase in the sound level is consistent with the momentary increase in the amplitude of the sample’s vibration velocity, thus the research methods that involve measurement and analyses of vibration and noise signals in the case of the examination of composite II – glass fibre reinforced laminate – offer comparability of the results and usefulness of their application. Compared to jute fibres, glass fibres are distinguished by a several times higher modulus, which results in their rapid breaking accompanied by emission of adequately “fast” waves of acoustic pressure.
Calculation of short-time spectra were conducted based on the signals of the vibration velocity and the acoustic pressure of the composite II test piece (parameters of fft calculations were adopted analogously to composite I). The results of this research – Figs. 12 and 13 – indicate different frequency characteristics of the change in the vibration and noise amplitude of composite II during the bending test than for composite I.
Fig. 11Characteristics of the change in the stress and acoustic pressure during the bending test of the composite II (glass) test piece: a) full course, b) magnified fragment
In the test piece deflection range of up to 3 mm, minor local increases in the vibration signal amplitude are observed in the spectrum, in the frequency range above 5 kHz. In the further part of the measurement, when the test piece deflection was in the range from 3.1 to approximately 6 mm, a significant increase in the vibration amplitude in the band above 1.8 kHz can be observed. In this measurement range, numerous local maxima of the vibration amplitude can be observed in the range of approximately 2.5 kHz, 5.5 kHz, 6.2 kHz and 8-9 kHz. This is connected to the gradual breaking of both the fibres and the matrix, and the release of the elastic strain energy accumulated during the effort of the material.
Fig. 12Short-time spectra of the vibration signal – composite test piece II (glass)
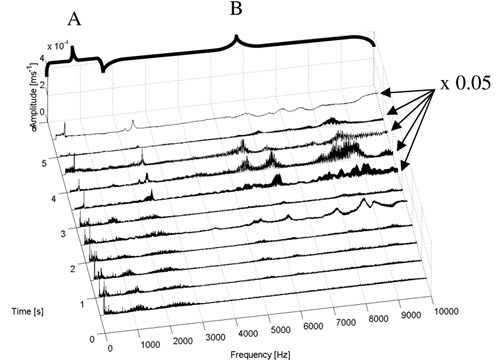
Fig. 13Short-time spectra of the acoustic pressure signal – composite test piece II (glass)
The calculated short-time spectra of acoustic signal confirm the changes observed in the vibration signal. During deflection of the samples above 3 mm, the local increase in the sound level is similar to that in the case of the vibration signal in the frequency bands above 1.8 kHz, with the maximum values in the band 6.0-9.5 kHz.
Identification calculations of the constituents of spectra via signal filtration were conducted in the same manner as in the case of composite I. The results of these calculations indicated that the same frequency ranges as in the case of composite I, designated A (0-1800 Hz) and B (1800-10000 Hz), constitute spectrum ranges which do not contain information on the test piece damage symptoms and spectra ranges which contain this information, respectively. The comparison of the signal recorded during measurements and of the same signal after low- (band A) and high-pass (band B) filtration is shown in Figs. 14 and 15.
These results confirm that the conducted vibration and acoustic pressure signal filtration and separation of constituents created as a result of damage to the test piece are correct, just as in the case of composite I tests.
One of the methods of describing qualitative changes occurring in vibration and noise signals is their analysis using point characteristics [46, 47]. A quantitative description of changes of the condition using these measures is applied in both structural examination and in the evaluation of the technical condition of plants and machinery. By introducing threshold values of these measures it is possible to build automatic systems to monitor the technical condition, e.g. in diagnostic systems of plant and machinery theses are classified in two categories: operating correctly or damaged.
Fig. 14Vibration velocity signal recorded during tests of composite test piece II (glass)
a) Frequency range 0 – 10,000 Hz
b) Frequency range 0 – 1800 Hz
c) Frequency range 1800 – 10000 Hz
Fig. 15Acoustic pressure signal recorded during tests of composite test piece II (glass)
a) Frequency range 0 – 10,000 Hz
b) Frequency range 0 – 1800 Hz
c) Frequency range 1800 – 10000 Hz
In this paper, non-dimensional point characteristics were used to describe the quantitative changes in the vibration and acoustic pressure signals occurring when the composite materials are bending. The application of quantitative measures will enable in that case qualifying the composite to one of the two groups: material in which no damage has occurred or material in which damage has occurred.
The following characteristics were used:
– Shape factor:
– Crest factor:
– Peak-to-average ratio:
– Clearance factor:
– Kurtosis:
where:
where, – momentary value of signal amplitude, – time, – averaging time.
, , , and point characteristics were calculated for vibration and acoustic pressure signals of composite I and II test pieces in the entire frequency range and for signals filtered in the 0-1800 Hz and 1800-10,000 Hz frequency range. Time course of these signals are shown in Figs. 8-9 and 14-15.
Fig. 16Point characteristics of vibration signals calculated based on the measurements of composite I in the following frequency ranges: 0-10000, 0-1800 and 1800-10000 Hz
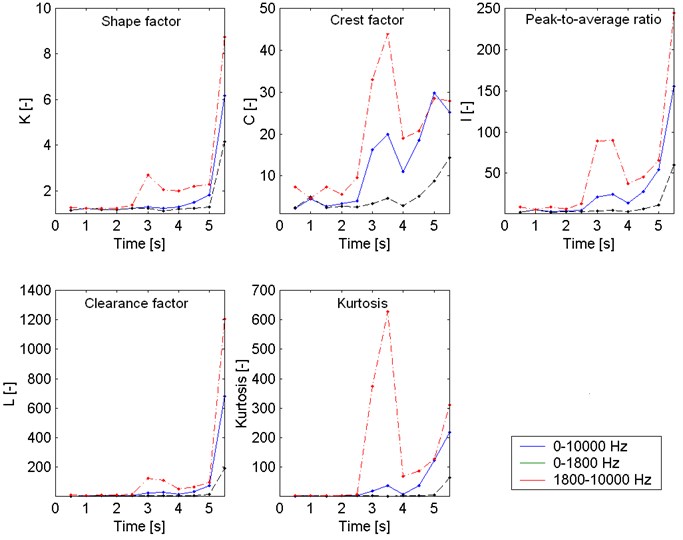
Fig. 17Point characteristics of the acoustic pressure signal calculated based on the measurements of composite I in the following frequency ranges: 0-10000, 0-1800 and 1800-10000 Hz
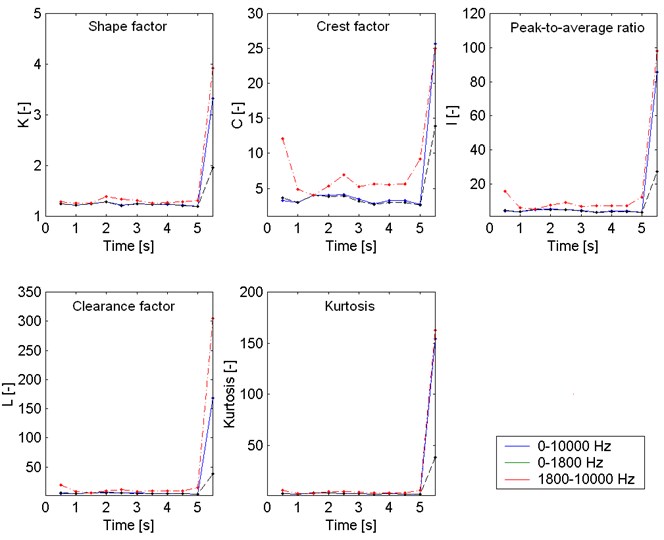
Fig. 18Point characteristics of vibration signals calculated based on the measurements of composite II in the following frequency ranges: 0-10000, 0-1800 and 1800-10000 Hz
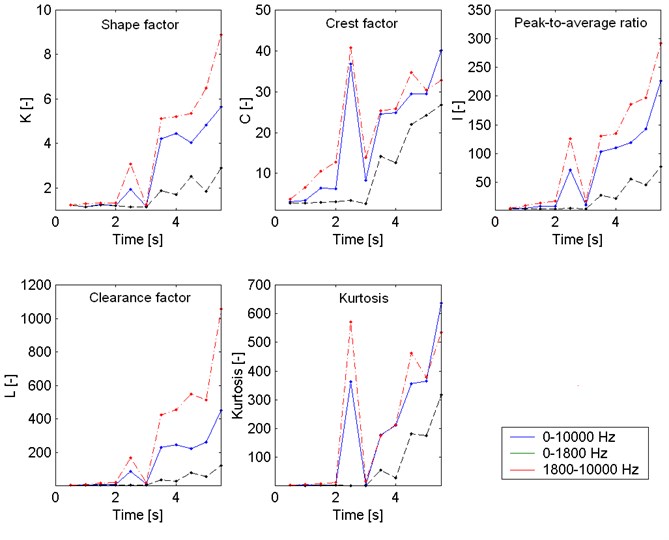
Fig. 19Point characteristics of the acoustic pressure signal calculated based on the measurements of composite II in the following frequency ranges: 0-10000, 0-1800 and 1800-10000 Hz
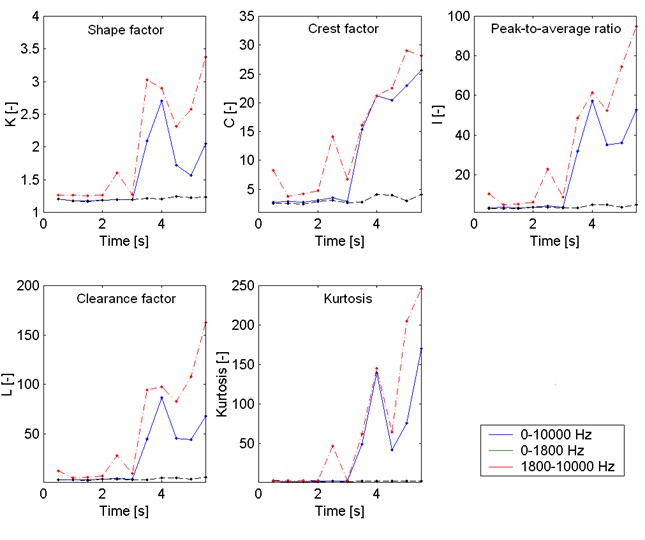
In order to assess the sensitivity of the determined point characteristics to momentary changes in the condition of composite materials, the calculations were conducted in subsequent time intervals of a length of 0.5 s (10000 samples), just as in the case of the calculations of the short-time fast Fourier transform (Figs. 6-7 and 12-13). The results of calculations of point characteristics are shown in Figs. 16-19.
As demonstrated by the presented calculations, point characteristics determined based on vibration and acoustic pressure signals of composite test pieces recorded during the bending of these pieces may be used to evaluate damage present in them.
The results of calculations conducted for filtered signals in various frequency ranges confirmed, that the frequency range over 1800 Hz adopted based on initial tests is the most representative range for the assessment of damage in the examined composite tests. The calculated values of point characteristics indicate damage to composite materials during bending. As the state of glass- and jute fibre reinforced polymer laminates changes due to bending of specimens, an increase in values of calculated measures is observed. The threshold values of the measures above which degradation of the composites was observed in the examination are presented in Table 2.
Table 2Threshold values of point characteristics of the investigated composites
Point characteristic | Vibration signal | Acoustic pressure signal |
Shape factor | >2 | >1.5 |
Crest factor | >15 | >14 |
Peak-to-avarage ratio | >25 | >20 |
Clearance factor | >50 | >25 |
Kurtosis | >50 | >25 |
It has been observed during tests that in case of composite I (jute fibre reinforced laminate) early symptoms of a degradation failure are present for values of measures calculated based on the vibration signal, which is caused by the low value of the elasticity modulus of that material (Table 1). In this case the vibration signal makes it possible to detect damage at deflection of approximately 3 mm, whereas the acoustic signal allows the detection of a significantly greater destructive failure caused by bending (above 5 mm), which in this case results from a significantly smaller release of the acoustic energy during cracking.
The results of calculated point characteristics for composite II (glass fibre reinforced laminate) confirmed analysis results obtained earlier, which indicate that both the vibration and acoustic signal contain symptoms of early degradation in that composite. The usefulness of these two signals in the early detection of a degradation failure is related to the high value of the elasticity modulus of composite II (Table 1). The calculated distinctive point characteristics made it possible to detect the progressive damage to composite II already at deflection of approximately 2.5 mm.
5. Conclusions
The conducted tests of static bending of resin composites reinforced with jute and glass fabrics allow the conclusion that the relation stress - deflection did not show local fluctuation until the start of the components breaking process. The application of contactless and non-destructive high-frequency measurements of vibration velocity and acoustic pressure signals and their analysis made it possible to observe phenomena related to damage to the test pieces. Of particular importance is the identification of vibration and noise indicating damage to material in the range of deflection entering the elastic range on the mechanical curve.
The conducted processing of signals, whose purpose was to assess the change in the amplitude of the spectrum of vibration velocity and acoustic pressure signals during the bending of test pieces demonstrated that in this case composite vibration and acoustic pressure should be monitored during the bending of the composite in frequency band over 1800 Hz.
Calculations of signals point characteristics, which demonstrated sensitivity to damage in the examined test pieces, were also performed in the paper. Therefore, the values of these characteristics may be a diagnostic symptom of damage to composite materials subjected to bending. Thresholds of five basic point characteristics were also determined. If these parameters are exceeded, this means that laminate damage processes (fibre and matrix breaking) take place.
The examination conducted as part of the study and analysis of its results allow formulating a general conclusion that the application of contactless and non-destructive methods of vibration and noise measurement broadens the results obtained by means of basic measurements performed until now using strength testing machines. The proposed methods of measurement and analysis of vibroacoustic signals have a utilitarian nature, offer comparability of the results and can be regarded as research methods alternative to acoustic emission. Owing to the lack of contact with the analysed material they may be widely applied in diagnostic and safety systems of structures. In particular, the use of both methods concurrently (for one plant) seems to be interesting. Vibration measurement is particularly accurate in the lower velocity range of elastic waves, while measurement of acoustic pressure exhibits very good efficacy in the range of higher velocities (e.g. cracking of glass fibre).
The need should be pointed out here to carry on further analyses of vibration and noise signals in the direction of early detection of destructive failure of composite materials by means of the proposed methods for the measurement of vibration and noise.
References
-
Bienias J., Majerski K., Surowska B., Jakubczak P. The mechanical properties and failure analysis of selected fiber metal laminates. Composites Theory and Practice, Vol. 3, 2013, p. 220-224.
-
Chou J. S., Chiu C. K., Huang I. K., Chi K. N. Failure analysis of wind turbine blade under critical wind loads. Engineering Failure Analysis, Vol. 27, 2013, p. 99-118.
-
Savage G. Formula 1 Composites Engineering. Engineering Failure Analysis, Vol. 1, 2010, p. 92-115.
-
Wanhill R. J. H., Grooteman F. P., Oldersma A. Validation of F-16 Wing Attachment Fitting bolts. Engineering Failure Analysis, Vol. 35, 2013, p. 16-24.
-
Dai H. L., Guo Z. Y., Yang L. Nonlinear dynamic response of functionally graded materials circular plates subject to low-velocity impact. Journal of Composite Materials, Vol. 47, Issue 22, 2013, p. 2797-2807.
-
Koziol M. Experimental study on the effect of stitch arrangement on mechanical performance of GFRP laminates manufactured on a basis of stitched performs. Journal of Composite Materials, Vol. 46, Issue 9, 2012, p. 1067-1078.
-
Koziol M. Effect of thread tension on mechanical performance of stitched glass fibre-reinforced polymer laminates – experimental study. Journal of Composite Materials, Vol. 47, Issue 16, 2013, p. 1919-1930.
-
Koziol M., Wieczorek J., Bogdan-Wlodek A., Myalski J. Evaluation of jute fiber preforms absorbability using optical profilographometer. Journal of Composite Materials, Vol. 47, Issue 19, 2013, p. 2309-2319.
-
Gieleta R., Gotowicki P., Poplawski A. Strain rate effects on selected mechanical properties of glass-polyester laminates. Composites Theory and Practice, Vol. 2, 2013, p. 122-127.
-
Koziol M., Bogdan-Wlodek A., Myalski J., Wieczorek J. Influence of wet chemistry treatment on the mechanical performance of natural fibres. Polish Journal of Chemical Technology, Vol. 13, Issue 4, 2011, p. 21-27.
-
Bogdan-Wlodek A., Koziol M., Myalski J. Influence of surface treatment on the wetting process of jute fibres with thermosetting polyester resin. Polish Journal of Chemical Technology, Vol. 14, Issue 1, 2012, p. 21-27.
-
Zimniewska M., Myalski J., Koziol M., Mankowski J., Bogacz E. Natural fiber textile structures suitable for composite materials. Journal of Natural Fibers, Vol. 9, Issue 4, 2012, p. 229-239.
-
Koziol M., Sleziona J. Failure progress of stitched reinforced polyester-glass laminate at static bending. Polimery, Vol. 53, Issue 11-12, 2011, p. 502-508.
-
Baltopoulos A., Polydorides N., Pambaguian L., Vavouliotis A., Kostopoulos V. Damage identification in carbon fiber reinforced polymer plates using electrical resistance tomography mapping. Journal of Composite Materials, Vol. 26, 2013, p. 3285-3301.
-
McLendon W. R., Whitcomb J. D. Characteristic failure initiation sites in plain weave textile composites. Journal of Composite Materials, Vol. 25, 2013, p. 3143-3161.
-
Wang K., Inman D. J., Farrar C. R. Modeling and analysis of a cracked composite cantilever beam vibrating in coupled bending and torsion. Journal of Sound and Vibration, Vol. 284, Issue 1-2, 2005, p. 23-49.
-
Cawley P., Adams R. D. Vibration technique for non-destructive testing of fibre composite structures. Journal of Composite Materials, Vol. 13, 1979, p. 161-175.
-
Dimarogonas A. D. Vibration of cracked structures: A state of the art review. Engineering Fracture Mechanics, Vol. 55, Issue 5, 1996, p. 831-857.
-
Sih G. C., Chen E. P. Mechanics of Fracture 6: Cracks in Composite Materials, 1981.
-
Wauer J. Dynamics of cracked rotors: A literature survey. Applied Mechanics Reviews, Vol. 1, Issue 1, 1991, p. 1-7.
-
Gibson R. F. Modal vibration response measurements for characterization of composite materials and structures. Composites Science and Technology, Vol. 60, Issue 15, 2000, p. 2769-2780.
-
Figlus T., Wilk A. Application of analysis of envelope's spectrum for gearbox diagnosing. International Review of Mechanical Engineering, Vol. 6, Issue 6, 2012, p. 1350-1355.
-
Radkowski S., Jasinski M. Nonlinearity and intermodulation phenomena tracking as a method for detecting early stages of gear failures. Archives of Transport, Vol. 22, Issue 4, 2000, p. 447-462.
-
Antoni J., Bonnardot F., Raad A., Badaoui M. Cyclostationary modelling of rotating machine vibration signals. Mechanical Systems and Signal Processing, Vol. 18, 2004, p. 1285-1314.
-
Dziurdz J. Transformation of nonstationary signals into pseudostationary signals for the needs of vehicle diagnostics. Acta Physica Polonica A, Vol. 1, 2010, p. 49-53.
-
Dybala J., Zimroz R. Rolling bearing diagnosing method based on empirical mode decomposition of machine vibration signal. Applied Acoustics, Vol. 77, 2014, p. 195-203.
-
Burdzik R., Konieczny Ł. Application of vibroacoustic methods for monitoring and control of comfort and safety of passenger cars. Diffusion and Defect Data Pt.B: Solid State Phenomena, Vol. 210, 2014, p. 20-25.
-
Dabrowski Z., Zawisza M. Investigations of the Vibroacoustic Signals Sensitivity to Mechanical Defects Not Recognised by the OBD System in Diesel Engines. Solid State Phenomena, 2011, p. 194-199.
-
Konieczny Ł., Burdzik R., Łazarz B. Application of the vibration test in the evaluation of the technical condition of shock absorbers built into the vehicle. Journal of Vibroengineering, Vol. 15, Issue 4, 2013, p. 2042-2048.
-
Urbanek J., Barszcz T., Zimroz R., Antoni J. Application of averaged instantaneous power spectrum for diagnostics of machinery operating under non-stationary operational conditions. Measurement: Journal of the International Measurement Confederation, Vol. 45, Issue 7, 2012, p. 1782-1791.
-
Yu G. B., Zhao Y., Nie J. F., Dai B., Song X. W. Gearbox fault diagnosis research based on wavelet transform. Applied Mechanics and Materials, Vol. 274, 2013, p. 233.
-
Wang Y., Yang J., Ji Z. Study on gasoline engine knock indicators based on wavelet transform and rough set. Advanced Materials Research, 2013, p. 625-630.
-
Gajdzik B., Wieszała R. Measurements of the communication noise level on the internal roads of the manufacturing metallurgical enterprise. Metalurgija, Vol. 51, Issue 3, 2012, p. 369-372.
-
Ragulskis M.,Maskeliunas R. Measurement of transverse vibrations of piezoelectric ceramics by atomic force microscopy. Experimental Techniques, Vol. 30, Issue 2, 2006, p. 37-41.
-
Czech P. Diagnosis of industrial gearboxes condition by vibration and time-frequency, scale-frequency, frequency-frequency analysis. Metalurgija, Vol. 51, Issue 4, 2012, p. 521-524.
-
Grzadziela A. Vibration analysis of unbalancing of gas turbines rotors. Proc. of the Tenth International Congress on Sound and Vibration, 2003, p. 4997-5004.
-
Maczak J. Local meshing plane analysis as a source of information about the gear quality. Mechanical Systems and Signal Processing, Vol. 38, Issue 1, 2012, p. 154-164.
-
Yang C., Feng T. Abnormal noise diagnosis of internal combustion engine using wavelet spatial correlation filter and symmetrized dot pattern. Applied Mechanics and Materials, Vol. 1, 2012, p. 168-173.
-
Syta A., Jonak J., Jedliski L., Litak G. Failure diagnosis of a gear box by recurrences. Journal of Vibration and Acoustics, Vol. 134, Issue 4, 2012.
-
Figlus T., Wilk A., Krajzel, K. The influence of drive parameters and technical condition on the vibroactivity of devices with single-cylinder internal combustion engines. Transport Problems, Vol. 8, Issue 1, 2013, p. 79-85.
-
Figlus T., Liščák Š., Wilk A., Łazarz B. Condition monitoring of engine timing system by using wavelet packet decomposition of a acoustic signal. Journal of Mechanical Science and Technology, Vol. 28, Issue 5, 2014, p. 1663-1671.
-
Figlus T., Stańczyk M. Diagnosis of the wear of gears in the gearbox using the wavelet packet transform. Metalurgija, Vol. 53, Issue 4, 2014, p. 673-676.
-
Wilk A., Madej H., Figlus T. Analysis of the possibility to reduce vibro activity of the gearbox housing. Maintenance and Reliability, Vol. 50, Issue 2, 2011, p. 42-49.
-
Utpat A., Ingle R. B., Nandgaonkar M. R. Experimental study of bearing failure analysis at higher speed by simulating local defect on its races. International Review of Mechanical Engineering, Vol. 5, Issue 3, 2011, p. 442-448.
-
Deuszkiewicz P., Radkowski S. On-line condition monitoring of a power transmission unit of a rail vehicle. Mechanical Systems and Signal Processing, Vol. 17, Issue 6, 2003, p. 1321-1334.
-
Ma R., Chen Y., Cao Q. Research on dynamics and fault mechanism of spur gear pair with spalling defect. Journal of Sound and Vibration, Vol. 331, Issue 9, 2012, p. 2097-2109.
-
Nikolaou N. G., Antoniadis I. A. Application of morphological operators as envelope extractors for impulsive-type periodic signals. Mechanical Systems and Signal Processing, Vol. 17, Issue 6, 2003, p. 1147-1162.
-
Barczewski R., Jakubek B. Problems of in-situ vibroacoustic testing of low-vibroactive devices. Vibrations in Physical Systems, Vol. 25, 2012, p. 59-64.
About this article
