Abstract
The blasting operation is vital in the construction of tunnels and channels or in mining when encountering hard geological environments to facilitate the progress of a project. The level and range of damage due to the blast are affected by the energy of shock waves generated after explosion. The control of seismic damage is a major issue in blasting engineering and cannot be neglected. The stratum layer or buildings on the earth’s surface can be damaged when blasting-induced vibration strength exceeds the allowed range. In order to reduce the degree of damage, the patterns of blasting vibration must be studied and controlled. Therefore, the propagation characteristics of shock waves on the earth’s surface are important factors to be studied before the planning and designing of a project. This paper adopted a mutual verification method between the blasting experiment and numerical analysis results for verifying the reliability of numerical simulation based on experimental data. The numerical analysis method analyzed the dynamic mechanical behavior of blasting vibration using the finite element method. The LS-DYNA program was used to simulate TNT explosive and surface contact blasting in semi-infinite space and in propagation of the resulting seismic waves. The propagation characteristics, represented by temporal and spatial changes of surface acceleration, were investigated. The analysis results showed that post-explosion dynamic characteristics of the earth’s surface simulated by finite element method yielded promising simulation results. In addition, the propagation characteristics of stress waves were observed from the dynamic mechanical behavior of surface acceleration after explosion. That is, the maximum main stress presented a pattern of progressive attenuation with increasing distance from the blasting source. The results are able to provide reference for the protection of engineering structures from blasting vibration damages.
1. Introduction
The process of blasting involves fast release or transformation of energy within limited space and extremely short time. The blasting operation involves the destruction of the structure of an object using instant high pressure and blast waves. The goal of the operation is to fragment the target object by placing explosives at appropriate positions on it. The seismic effects of blasting include seismic phenomena and effects induced by explosions in geological environments. These effects are caused by mutual interactions between the vibrations resulting from the blast and the vibrating object. Investigation of the seismic effects of the blast mainly focuses on the motion characteristics of the medium of vibration and the impact of the vibrations on the structure during explosions [1, 2]. Since discovered the seismic wave phenomenon, research concerning blast induced seismic effect has not been limited to academics. Blasting techniques have been widely utilized in hydraulics, transportation, mining, construction, and natural disaster relief. The analyses of their extent of hazard are mainly based on the transmission characteristics of ground surface vibrations intensity and its reflection phenomenon. For example, reflected seismic waves provide important information on the structure of underground formations. In military engineering, important military facilities are generally constructed in form of underground bunkers to increase their defense capabilities, reduce the effects of blast wave energy, and achieve protection. In addition, blast induced ground vibrations is an effective method for searching natural reservoirs of gas and oil under the surface of Earth, and using for the preliminary engineering safety assessment in blast engineering environments. This study investigated the surface seismic effects induced by contact blasting, and provided reference information that can be used to plan military facilities in the future, by reducing seismic risks and preventing disasters.
When explosives explode on the earth’s surface, the pressure from the resultant gases produces blast waves that cause the surface to move and the ground to vibrate. Vibration of the earth’s surface is caused by explosion-induced shock wave in soil [3]. Due to the requirement of significant financing to conduct blasting experiments as well as the consideration of related issues such as safety, source of explosives, and confidentiality levels, the acquired experimental data were limited. The numerical simulation method is adopted by most blasting analysis studies to investigate the characteristics of blast waves and the corresponding effects on architectural structures. Most researchers use LS-DYNA as the research tool for explosion and blasting analysis and adopt the US military technical manuals for protective blast design, TM5-1300 [4] and TM5-855-1 [5], as the basis for analytical comparison. To study the parameters of vibrations caused by blasting, the perspective of energy transformation during explosion, and the conservation theorem of mass, energy, and momentum when transmitting blasting and shock waves are used as bases. Based on the characteristics of shock waves, the velocity, acceleration, stress, and displacement of the vibrations can be assessed to analyze the effects of and damages caused by the explosion on the object, which needs to be protected. Therefore, the level of damage of surface bursts is generally analyzed according to the characteristics of shock waves and the effect of vibrations on the earth’s surface.
The studies on vibrations caused by blasting can be generally divided into two categories: field experiments and numerical simulation analyses. Wang and Lee [6] conducted blasting numerical simulation using C-4 explosive to assess the concave grooves, in order to explore the propagation patterns of blast waves. By comparing the results of the field experiment to those of numerical simulation analysis, it was found that the LS-DYNA finite element program was able to effectively analyze the transmission of surface blast waves induced by surface bursts. Kivity et al. [7] conducted an experiment, involving the simulation of explosion at an ammunition depot. The results of the experiment demonstrated that with the same amount of explosives, the extremum of free field blast pressure was approximately one-third of that of the surface blast pressure. The results further reported a relative error of 15 % between the extremum of blast pressure and the experimental value. Related studies revealed that analysis errors of blast pressure became larger when the measurement site was closer to the source of the blast and that the relative errors at larger distances were fairly close. Hung Cheng-Wei [8] measured blast pressure extrema using blast pressure sensors, in the free field explosion experiments using C-4 explosives. The results were compared with standards in the US military manual TM5-855-1 [5], and they were found to yield overall relative errors up to 13 %. The error was less than 5 % when the scale distance was between 2-2.37.
Crandle [9] investigated the propagation pattern of blasting-induced seismic waves, the factors affecting the strength of vibrations, and the impact of damages caused by blasting. His study indicated that the seismic waves induced by blasting propagate outward through the propagation media. During the propagation, seismic waves cause particle vibrations in surrounding media, leading to ground vibrations. Once the ground vibrations reach a certain strength, buildings and facilities, along with slopes, tunnels, bridges and roads within a certain range from them are varyingly affected and in the worst cases, they are completely damaged. The behavior of blast wave is found to be extremely complex and quantitative assessment of blasting parameters is challenging from a geological perspective. To analyze the effect of vibrations during blasting, it is necessary to determine the values of physical parameters, such as particle displacement, velocity, and acceleration. In engineering construction, the vertical peak particle velocity is often used as a reference to analyze the strength of vibrations caused by blasting. The levels of damage caused by air bursts and surface bursts are generally analyzed in accordance with the characteristics of shock waves and the effect of vibrations on the earth’s surface. Therefore, this paper considered surface contact blasting to analyze the effect of vibrations on the earth’s surface and thus, generate reference information for the implementation of relevant measures against vibrations during engineering activities and construction, with the goal of achieving secure protection.
2. Research methods
The effects of blasting can be evaluated by dynamically analyzing geometric, material, and contact nonlinearities, where precise analytical analysis is hard to achieve. Most studies are based on mutual verification between experimental data and analysis results of numerical simulation. This paper makes use of the field blasting experiment and numerical analysis method to investigate the effect of surface vibration. The reliability of the analysis was validated by mutual verification between measured experimental data and analysis results of numerical simulation.
2.1. Blasting experiment
Surface contact blasting experiments were conducted using 0.5 lb (226.796 g) TNT explosives. The vertical acceleration of the earth’s surface was measured at sites that were 300 cm and 400 cm away from the source of the blast. Fig. 1 shows the field configuration scheme. The instruments used in the experiments included accelerometer, oscilloscope, signal conditioner, power supply system, and data acquisition system. The voltage output accelerometer, 352C16 series, manufactured by PCB Inc., USA, was used to measure the blasting-induced acceleration of the earth’s surface. The acceleration signal was fed into the oscilloscope through the signal conditioner for signal transmission and acquisition. The collected data can be directly stored in a computer or transferred to it through an USB interface. During the course of the experiment, the instruments and signal cables should be avoided from being exposed to blast pressure or fireballs for preventing the instruments from getting damaged and the signal cables from getting swayed or broken.
Fig. 1Field configuration scheme of blasting experiments. Explosion test as planned uses 0.5 (lb) of TNT, blast pressure meter is placed 300 cm and 400 cm from the detonation
2.2. Numerical analysis method
The LS-DYNA program used in the study for analyzing the blasting wave effect induced by explosions was a finite element method for fluid dynamics. The fluid dynamic program was based on the continuum mechanics theory, which solves the dynamic time integration problem using explicit time integration. The program is able to fully characterize the explosion-induced fluid dynamic behavior for gas and effectively analyze the nonlinearity and large deformation behavior of three-dimensional space structures. As such, the program is suitable for solving nonlinear dynamic problems including high velocity impact and explosion of three-dimensional nonlinear structures.
2.2.1. Arbitrary Lagrangian-Eulerian (ALE) algorithm
The Lagrangian algorithm is suitable for analyzing the deformation of the material and is also applied in stress and strain analysis of solid structures. The disadvantage of this algorithm is, with large displacement and deformation, the finite element mesh shows severe distortion or negative volume, leading to numerical error and termination of the program. If the mesh and the substances being analyzed are mutually independent, the Eulerian algorithm can effectively analyze the conditions such as fluid flow, gas diffusion and mixture. However, the drawback of this algorithm is that it is difficult to determine the material ratio [10].
Cook [11] solved the system of equations of mass, momentum, and energy conservation stated in Eqs. (1)-(3) and published the Arbitrary Lagrangian-Eulerian (ALE) algorithm. The ALE algorithm overcomes the drawbacks found in the Lagrangian and the Eulerian algorithms whilst retaining their advantages. The ALE algorithm can effectively control and track the movement of structure boundaries and is commonly applied in real-time dynamic analysis in coupled fluid and solid [12]. The advantage of ALE algorithm is that the meshes can be constructed according to the substance boundaries and calculations on severely distorted meshes can be avoided. In this way, the ALE algorithm overcomes the drawbacks in Lagrangian and Eulerian algorithms and is able to deal with problems like explosion and high velocity impact [13]. This study adopted the ALE method for numerical analysis of the coupling state between fluid and solid, whereby the Eulerian algorithm (spatial description method) was used in characterizing the fluid and Lagrangian algorithm (material description method) was used in describing the solid, to ensure the conservation of mass, momentum, and energy:
where is a spatial region with unitary activities; represents the region boundary; and is the velocity of .
2.2.2. Time integration
Time integration is an approximate response, including displacement, velocity, and acceleration, at discrete time points. It is a time increment step-by-step numerical calculation, which is classified into explicit method and implicit method. The explicit method uses data from the previous time point to calculate the response at the next time point. The calculation in explicit method is simple but the time step is affected by the natural vibration frequency of the structure. On the other hand, the implicit method uses unconditionally stable iterative equations.
For the calculation of non-linear iterative method, explicit integration is more appropriate because it enables to avoid the convergence issue in non-linear numerical solution. The explicit integration method uses smaller time step to handle the convergence problem and thus requires relatively longer computing time, which is acceptable because of the short duration of explosions. The time step control is determined using minimum value of the elements, which defines the conditional stability in explicit time integration. If the control coefficient of time step is not defined, the LS-DYNA program performs the calculation based on the minimum time step in elements i.e. the acceleration matrix at a given time is derived from the known velocity matrix using Eq. (4) while the velocity and displacement matrices are calculated by Eqs. (5) and (6) [14-16]:
with , where is the nodal acceleration matrix at ; is the nodal velocity matrix at ; is the mass matrix; is the matrix of external force vector; is the sum of element internal force and contact force; is the damping matrix and is the hourglass resistance force.
2.2.3. Element type
The LS-DYNA finite element analysis method provides multiple element types that can be selected for the calculation in accordance to the type of analysis and algorithm used. This study employed the ALE algorithm in conjunction with the three-dimensional (3D) eight node solid element for the analysis and calculation. The element was defined by eight nodes, out of which every node had nine degrees of freedom. Fig. 2 shows the three-dimensional spatial solid structure model of the element. The shape function of the element that was used to simulate soil, air, and explosives is defined in Eq. (7) [16]:
where , , and are coordinates of the unit with range of ±1 depending on different node positions.
Fig. 2Diagram of 3D eight node solid element [16]
![Diagram of 3D eight node solid element [16]](https://static-01.extrica.com/articles/15217/15217-img2.jpg)
![Diagram of 3D eight node solid element [16]](https://static-01.extrica.com/articles/15217/15217-img3.jpg)
Eqs. (8) and (9) represent the stability conditions of the solid element and Eq. (10) defines the characteristic length () of the eight-node solid element. The propagation velocity and volume modulus in elastic materials are defined in Eqs. (11) and (12). Eq. (13) calculates the minimum time interval of the element:
where is the function of volume viscosity coefficients and ; is the characteristic length; is the strain rate tensor; is the element volume; is the area at the longest side; is the sonic velocity in materials; is the mass density; is Young’s modulus; is shear modulus; is Poisson’s ratio; and is the number of elements.
3. Numerical simulation
In numerical analysis of dynamic response to blasting waves, the issues of surface contact blasting and the subsequent impact of the blasting waves produced by TNT explosive on the earth’s surface were considered. A fluid-solid coupling model for numerical analysis was constructed through simulation of the blasting experiment. In this method the explosive and air were set as Eulerian meshes and the soil was set as Lagrangian meshes. The blasting-induced acceleration in the earth’s surface was analyzed using the constructed model and the results were mutually verified against the blasting experiments.
3.1. Numerical model
The mathematical mode and physical model in numerical analysis were designed on the basis of the experimental conditions of surface blasting. The numerical analysis model was constructed with eight-node solid elements. The ALE was adopted as the algorithm with a unit system of cm-g-μs. The size of air was set as 920×120×220 (cm), with non-reflecting boundaries to simulate explosions in unlimited regions. Rectangular TNT explosive weighing 0.5 lb (226.8 g), density 1.63 g/cm3, and size 6.56×3.28×9.3 (cm) was placed in contact with the earth’s surface at the center of the model. The size of soil was 920×100×220 (cm). A 1/2 model was used in the analysis owing to the symmetry of the model. Fig. 3 shows the simplified 1/2 model for numerical analysis. The sizes of finite element meshes for air, explosive, and soil were 3.28 cm, 3.28 cm, and 6.56 cm respectively. The time step control coefficient (TSSFAC) was set at 0.5.
Fig. 3Schematic diagram of simplified 1/2 model of surface blast
3.2. Material parameters and equation of state
The constitutive equations describing the internal patterns of materials are illustrated using the relationship between stress tensor and strain tensor. The equation of state (EOS) characterizes the material constitutive equations manifested by the relationship between pressure (), volume () or density () and temperature () or specific internal energy () as in Eq. (14), or as the relationship between pressure (), material internal energy (), and changes in density or volume () post the impact from external forces as Eq. (15). For conditions of high velocity, temperature, and pressure, corresponding EOS are required to simulate the actual dynamic response and analyze the change of material volume as well as the response pattern following the impact from external force [16]:
3.2.1. Air material parameters
Table 1 shows the related parameters of the air material used in the study. The air material was simulated using the MAT_NULL model in the LS-DYNA program and the EOS_LINEAR_POLYNOMIAL shown in Eq. (16) was selected to characterize the material behavior [17]:
with , where is the initial internal energy in unit volume, is the coefficient of dynamic viscosity, , , , , , and are constants and is the relative volume.
Table 1Material parameters for air
(g/(cm3)) | (J/m3) | (g/(cm3)) | ||
1.29 | 2.5×10⁵ | 1.0 | 0.0 | 0.0 |
0.0 | 0.0 | 0.4 | 0.4 | 0.0 |
3.2.2. Explosive material parameters
Table 2 lists the related parameters for explosive materials. The material model of MAT_HIGH_EXPLOSIVE_BURN was used to simulate highly explosive dynamite according to EOS in the explosive manual provided by Lawrence Livermore National Laboratory. The Jones Wilkins Lee (JWL) EOS was used to characterize the material behavior as Eq. (17) [18]:
where , , , , and are constants pertaining to the explosive, is the relative volume, is the initial energy per initial volume and is the material internal energy. Table 2: is the mass density, is the detonation velocity, is the Chapman-Jouget pressure.
Table 2JWL and material parameters for TNT explosive
(cm/(μsec)) | (Mbar) | (Mbar) | (Mbar) | |
1.63 | 0.693 | 0.21 | 3.712 | 0.03231 |
OMEGA () | (J/m3) | |||
4.15 | 0.95 | 0.3 | 1.0 | 0.07 |
3.2.3. Soil material parameters
Table 3 shows the related parameters of soil materials used in the numerical analysis. The pores in material and the characteristics of crush and compaction must be considered while selecting the model for soil composition. Since the material has compressible plasticity, the model must be able to analyze porous materials. Based on the characteristics of the materials, the MAT_SOIL_AND_FOAM model in the program was selected to simulate the stress and strain behavior in the present study [17].
Prior to the field blasting experiment, field soil sample was obtained to analyze its physical and mechanical properties, and was further classified using the Unified Soil Classification System (USCS) for use during the numerical analysis. Fundamental tests of physical properties includes moisture content, unit weight of soil, specific gravity test, porosity, the Atterberg limit test and particle size analysis. Mechanical properties including shear strength parameters, cohesion () and friction angle () were obtained from direct shear test with controlled strain. The above tests were performed according to the ASTM standards. Each test was conducted in 5 sets, from which the average value was taken for each of the tests. The test results showed that the soil at the blasting experiment field was sand clay (SC) with a density of 1.78 (g/(cm3)).
Table 3Material parameters for soil
(g/(cm3)) | (MPa) | (MPa) | (MPa) | |||
1.78 | 0.000174 | 0.00729 | 9.025×10⁻¹² | 1.38×10⁻¹¹ | 5.28×10⁻¹² | –6.9×10⁻⁸ |
where is the mass density, is the shear modulus, is the bulk modulus, , , are yield function constant for plastic yield function below, and is the pressure cutoff for tensile fracture. | ||||||
4. Results and discussion
Figs. 4 and 5 show the acceleration time curves obtained from surface contact blasting experiments while Figs. 6 and 7 illustrate acceleration time curves from the numerical analysis of surface contact blasting. It has been observed from the figures that the acceleration tended to increase with increase in the amount of explosives, whereas when the same amounts of explosives were used, the acceleration appeared to attenuate with increasing distance from the blasting source. The scale table of earthquake intensity and the corresponding acceleration values were used to describe the intensity level of vibration experienced by people on the ground during an earthquake. The vibration intensity at 300 cm from the blasting source was classified as mild vibration where most people could feel the sways and some may wake up from their sleep. The intensity at 400 cm from the blasting source was regarded as weak vibration where almost everyone could feel the sways and some may experience fear.
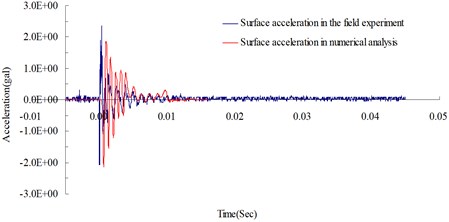
Figs. 8 and 9 show the surface acceleration time curves from both the experiment and simulation, which were measured at 300 cm and 400 cm from the blasting source respectively. The maximum surface acceleration values obtained from experiments were 7.98 gal (m/s2) and 2.48 gal (m/s2) while the ones from simulation were 7.27 gal (m/s2) and 2.14 gal (m/s2). The relative percentage errors (calculated as (surface acceleration from numerical analysis – surface acceleration from the experiment)/surface acceleration from the experiment ×100 %) were –8.89 % (at 300 cm from the blasting source) and –13.48 % (at 400 cm from the blasting source). The relative errors in the analysis results were within a reasonable range, which validates the reliability of the analysis method and the physical model used in the study.
This study conducted both field experiment and numerical analysis. The simulation analysis used a fluid-solid coupled Arbitrary Lagrangian-Eulerian analysis model to analyze the ground vibrations phenomenon. The results showed that this method can sufficiently describe the fluid dynamic behaviors of a blast and adequately analyze the coupling effect with solid to solve geometric non-linear, material non-linear and contact non-linear types of dynamic analysis problems.
Fig. 4Blasting experiment: surface acceleration time curve at 300 cm from the blasting source
Fig. 5Blasting experiment: surface acceleration time curve at 400 cm from the blasting source
Fig. 6Numerical analysis: surface acceleration time curve at 300 cm from the blasting source
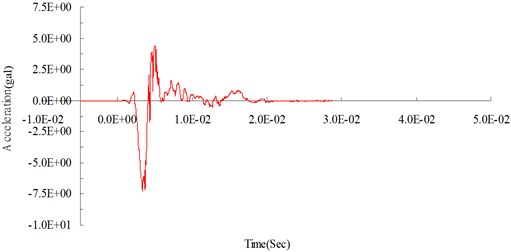
Fig. 7Numerical analysis: surface acceleration time curve at 400 cm from the blasting source
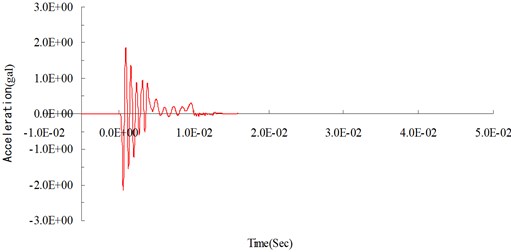
Fig. 8Surface acceleration time curves at 300 cm from the blasting source
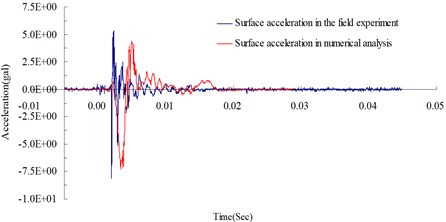
Fig. 9Surface acceleration time curves at 400 cm from the blasting source
5. Conclusions
Blasting-induced seismic effect is a process of energy transmission and transformation. It is an understanding of the attenuation property of blast waves during transmission that can facilitate the assessment of the magnitude of influence from such seismic effects. This study investigated the propagation pattern of the energy produced by contact blasting vibration and determined the dynamic response of surface acceleration under the impact of the blasting load, thereby protecting the facilities through the control of blasting wave energy generation and by reducing the damage caused by blasting-induced surface vibration. The surface acceleration values derived from blasting experiment data and numerical analysis were compared to verify the reliability of numerical simulation. The analysis results showed that seismic waves were mainly initiated by shock waves in air during surface burst. The shock waves close to the blasting source had a high velocity and intensity and the corresponding velocity and intensity of compressional waves in soil also increased. These are key parameters affecting the surface vibration, whose results could provide the basis for establishing the research model for blasting influence using numerical analysis. It also provides a reference for related engineering blasting and in seismic risk reduction and disaster prevention in protection projects.
References
-
Guowei M., Hong H., Yingxin Z. Assessment of structure damage to blasting induced ground motions. Engineering Structures, Vol. 22, 2000, p. 1378-1389.
-
Wang Z. Q., Lu Y. Numerical analysis on dynamic deformation mechanism of soils under blast loading. Soil Dynamics and Earthquake Engineering, Vol. 23, 2003, p. 705-714.
-
Wang Z. Q., Hao H., Lu Y. A three-phase soil model for simulating stress wave propagation due to blast loading. International Journal for Numerical and Analytical Methods in Geomechanics, Vol. 28, Issue 1, 2004, p. 33-56.
-
Structures to resist the effects of accidental explosions, technical manual TM5-1300. US Army Engineers Waterways Experimental Station, Washington, DC, 1990.
-
Fundamental of protection design for conventional weapons, technical manual TM 5-855-1. US Army Engineers Waterways Experimental Station, Washington, DC, 1998.
-
Wang I. T., Lee C. Y. Influence of concave groove on transmission of blasting vibration wave. Journal of Vibroengineering, Vol. 14, Issue 3, 2012, p. 1031-1040.
-
Kivity Y., Shafri D., Ben-Dor G., Sadot O., Anteby I. The blast wave resulting from an accidental explosion in an ammunition magazine. International Symposium on Military Aspects of Blast and Shock Conference, Canada, 2006.
-
Hung C. W. Prediction model of airblast pressure for ammunition storage magazines subjected to near-field explosion. Ph. D. Thesis, School of National Defense Science, Chung-Cheng Institute of Technology, National Defense University, Taiwan, R. O. C., 2012.
-
Crandle F. J. Ground vibration due to blasting and its effect upon structures. Boston Society, Civil Engineering, Vol. 36, 1949, p. 222-245.
-
Benson D. J. Computational Methods in Lagrangian and Eulerian Hydrocodes. University of California, San Diego La Jolla, CA 92093, 1990.
-
Cook R. D., Malkus D. S., Plesha M .E. Concepts and Applications of Finite Element Analysis. John Wiley & Sons, London, 1989.
-
Wang Y. T., Zhang J. Z. An improved ALE and CBS-based finite element algorithm for analyzing flows around forced oscillating bodies. Finite Elements in Analysis and Design, Vol. 47, 2011, p. 1058-1065.
-
Puso M. A., Sanders J., Settgast R., Liu B. An embedded mesh method in a multiple material ALE. Computer Methods in Applied Mechanics and Engineering, Vol. 245-246, 2012, p. 273-289.
-
Hughes T. J. R. The Finite Element Method: Linear Static and Dynamic Finite Element Analysis. Prentice-Hall, Englewood Cliffs, NJ, 1987.
-
LS-DYNA Theoretical Manual. Livermore Software Technology Corporation, 1998.
-
LS-DYNA Theory Manual. Livermore Software Technology Corporation, 2006.
-
LS-DYNA Version 971 User’s Manual. Livermore Software Technology Corporation, 2007.
-
Dobratz B. M. LLNL Explosive Handbook Properties of Chemical Explosives and Explosive Simulants. Lawrence Livemore National Laboratory, 1981.
About this article
This study was partially supported by the National Science Council in Taiwan through Grant NSC 102-2218-E-145-001.
