Abstract
The landing dynamic modeling technology for aircraft landing gear is based on accurate evaluation of the landing gear landing performance. Aiming to study the post landing gear, a model for dynamic analysis of the gear is established based on the analysis of the structure mechanical features and the characteristics of landing dynamic performance. The landing dynamic analysis of strut landing gear is conducted by using LMS Motion software. According to the comparative analysis between simulation and drop test, the dynamic modeling method is accurate and reasonable. To obtain the load distribution of each landing gear, a full aircraft model of multi-strut landing gear is built, and then the dynamic simulation analysis is carried out in different landing process. The study shows that the rear main landing gear bears the highest proportion of load. The initial pitch angle influences load distribution of each landing gear. A lateral force is exerted on the main landing gear tire, when the plane is landing asymmetrically. With landing condition becoming stable, the lateral force is eliminated.
1. Introduction
With the rapid developments of aviation science and technology, the requirements of aircraft payloads and comfort are hard to meet the requirement of large aircraft with traditional tricycle gear. To solve the increasing severity problem, the new landing gear with multi-wheels and multi-struts emerges as the times require. The usage of landing gear with multi-wheels and multi-struts brings the aircraft load redistribution, which can reduce the pressure of large aircraft on the runway and disperse the load absorbed by each landing gear strut as well. Thereby it improves the security of aircraft landing and lowers the requirement for the airport runway. Researches on the dynamic properties of landing gear generally include drop test and dynamic simulation analysis.
In 1992, Bovais conducted a landing test on aircraft with abnormal fuselage structure and high risk allocation, which released the compression mode of manned aircraft with remote manipulator system at a particular height. According to experiment, an accurate assessment of aircraft allocation mechanism and maneuverability was achieved [1]. In 1996, Daniel proposed a set of landing gear modeling method, which fully considered the impact of nonlinear performances including velocity squared damping and viscous damping. Besides, Daniel demonstrated the reliability of this new modeling technology in static and dynamic test [2]. In 2004, Douglas conducted a drop test and simulation analysis on Mars exploration rovers. With the establishment of reliable test system and excellent method of data acquisition and processing, effective experimental data was achieved [3]. In 2007, Bennett presented the design of soft landing system with 30,000 lb ballistic air delivery volume, the system can precisely land the 30,000 lb load on the accurate location by using bis-umbrella drogue. Bennett made a breakthrough through the relative drop test which is conducted on this system [4]. In 2012, Harriett described a 2D high speed photography measurement system invented by NASA, the measurement data was very efficient and accurate so that it can be devoted to experimental parts’ track and impact data in the vertical drop test of whole machine or parts [5].
In 1999, X. Wang introduced the analysis model of main landing gear and studied the application of the semi-active control system in aircraft landing and taxiing process [6]. In 2000, Ghiringhelli used the commercial dynamic software ADAMS to set up a full aircraft model and studied on the application of the Proportion Integration Differentiation (PID) controller used in semi-active simulation analysis technology, which combines with the experiment [7]. In 2002, Lyle described a finite-element analysis model of landing gear and analyzed the nonlinear problems occurred for landing [8]. In 2006, Khapane used a multi-body dynamics software SIMPACK and finite element analysis software NASTRAN to study the phenomenon of load instability produced by the brake mechanism and wheel interaction for landing gear landing [9]. In 2007, Lernbeiss introduced a multi-body system based landing-gear model and investigated the numerical simulation of a simple static and dynamic load by comparing with a finite element model [10]. In 2009, Kong conducted drop-impact analyses for the landing gear for the smart unmanned aerial vehicles and revised the landing-gear impact model [11]. In 2013, Han Yu used simulation analysis software LMS to build a rigid-flexible coupling simulation model of light aircraft main landing gear. Besides, she completed the drop-test simulation and analyzed the dynamic stress distribution of the flexible part of landing gear [12].
In this paper, a reasonable method for dynamic modeling of aircraft landing gear is proposed based on the landing dynamic investigation of a particular model of post landing gear by using the dynamic simulation technology and the drop test. The research achieves certain academic values as the modeling technology is applied into the analysis of landing gear with multi-struts. The clear research thinking and reliable research methods have laid the foundation of the future study of the aircraft landing gear.
2. Landing dynamic simulation of post landing gear
2.1. Mechanical model
The structure of landing gear should be simplified in order to meet the actual situation, conform to dynamic properties of landing gear, and simplify the calculation. The simplified structure of the strut landing gear and the force condition of each part are shown in Fig. 1.
Fig. 1Force diagram of the simplified structure of the strut landing gear
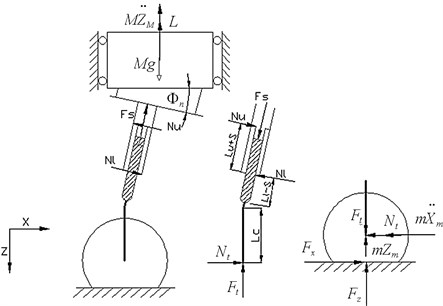
Before establishing the dynamic equations of landing gear, the following assumptions are needed:
1) All the forces of the landing gear are exerted within vertical plane of the landing gear.
2) The aircraft forward speed is not taken into account in the rotating and rebound stage.
3) At the initial stage of landing, lift and gravity are of the same size.
4) The elastic supporting mass can be idealized as rigid bodies concentrated near the trunnion.
5) In addition to the horizontal deflection of the buffer pillar, the other deformations of the structure are ignored.
2.2. System motion equations
Coordinate System: Here, the coordinate refers to the local coordinate system, which is moving along with the mass. The origin of the coordinate is located at the mass centroid of the aircraft. The coordinate’s positive direction is vertically downward, and the coordinate is perpendicular to the coordinate. The reverse course is referenced as the positive direction. According the aircraft landing performances, the aircraft landing process can be divided into three stages: the rotating stage, the rebound stage and the taxiing stage. On the basis of mechanical theory, the motion equations of strut landing gear can be obtained.
2.2.1. Equations of motion for the rotating stage
The vertical acceleration:
where is gravity acceleration, is lift, is vertical landing gear tire, is elastic support quality and is inelastic support quality.
The horizontal acceleration:
where is horizontal load of landing gear tire and is horizontal load of piston cylinder.
Tire rotation angular acceleration:
where is radius of the tire, is radial compression of tire and moment of inertia of tire.
At the buffer compression stage (while the tire continues to compress), the horizontal motion equation of concentrated mass retains the same, while the vertical motion equation is shown in Eq. (4).
The vertical acceleration:
where is axial force for buffer and is anteversion of nose landing gear.
2.2.2. Differential equations of motion for the rebound stage
When , the rebound stage begins. Generally, (the radius of the tire) is relatively much greater than the tire radial compression ( means the radial compression of tire). Approximately assuming , the motion differential equation of the rebound stage can be derived. At this stage, the horizontal motion equation of concentrated mass retains the same, while the vertical motion equation is shown in Eqs. (5) and (6).
The horizontal acceleration:
Tire rotation angular acceleration:
2.2.3. Equations of motion for the taxiing stage
The motion equations of taxiing stage are similar to the motion equations of rotating stage for landing. Assuming , the motion equations of taxiing stage are obtained.
2.3. Forces calculation of buffer system
The axial force of buffer is comprised of oil damping force , air spring force , internal friction force and structure constraint force .
The following are the derivation of calculation equations of buffer’s each force.
2.3.1. Oil damping force
The oil damping force is produced due to the pressure difference caused by the flow of hydraulic oil through both ends of the hole. Due to the oil damping force is the important component of the axial force of buffer; the viscous damping force can’t be simply taken as a suspect. According to local pressure loss theory, the oil damping force can be derived by formula. The calculation formula of oil damping force is shown in Eq. (7):
where is oil hole area, is pressure oil area, is flow coefficient of hole, is oil density and is travel speed.
2.3.2. Air spring force
The air spring force is determined by the initial pressure, the area covered by the gas pressure and the instantaneous compression ratio. The instantaneous compression ratio can be calculated from the air polytropic compression rule. The following equation is obtained:
where is chamber pressure of buffer, is initial pressure, is initial volume and is air polytropic exponent.
The calculation of air spring force is shown in Eq. (9):
where is gas pressure area, is atmosphere pressure and is buffer stroke.
2.3.3. Internal friction force
Buffer internal friction force is influenced by a lot of factors. The friction emerged at the collar between inside and outside of the buffer cylinder is only taken into consideration. The calculation of internal friction force is shown in Eq. (10):
where is axial friction force, is coefficient of friction for upper bearing, is normal force on upper bearing and is coefficient of friction for lower bearing.
2.3.4. Structure constraint force
When the buffer is loaded and starts to be compressed, the buffer stroke equaling the mechanism stroke, buffer cylinder moves to the lower arm of outer cylinder. The drag caused by the lower arm of outer cylinder prevents the cylinder moving is as we called the structure constraint force which could be simulated by the spring with infinite elasticity.
2.3.5. Stress analysis of the wheel
Vertical reaction force from the ground and the frictional interaction force is exerted on the wheels. The vertical force is shown in Eq. (11):
where is wheel number, is tire vertical deformation coefficient, is tire vertical damping coefficient, is wheel hub vertical displacement and is wheel hub vertical speed.
The friction between tire and ground is shown in Eq. (12):
where is coefficient between tire and ground.
2.4. Landing dynamic simulation analysis
Fig. 2Simulation model of strut landing gear
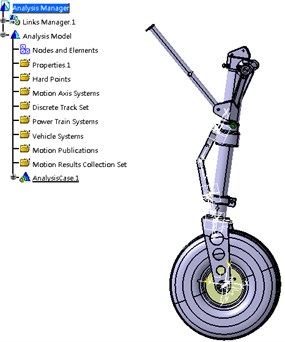
Simulation model of the strut landing gear of a particular model of aircraft is shown in Fig. 2. On the basis of the simulation model of the landing gear, limited drop test of the landing gear is conducted to calculate simulation. In the model, the initial condition parameters including the drop height, the rolling speed, and the initial air pressure are set as shown in Table 1.
The friction between the wheel and the platform is defined by the curve, and the elastic constant of the wheel is defined by the curve. The friction factor between the inner barrel and the piston rod of the buffer is set at 0.11, which is from the calculation of test result.
Table 1Project parameters of the limited drop test
Drop height | Effective drop weight | Diameter of main oil hole | Diameter of one-way oil hole | Initial pressure | Rolling speed |
427 mm | 329.8 kg | 4.2 mm | 2.5 mm | 0.6 MPa | 1300 min |
2.5. Validation of simulation model
To verify the validity of model, experimental data from reference [12] are cited. The drop test of the strut landing gear of a particular aircraft has been repeated three times. The test results are consistent with the theoretical expectations, which satisfy the airworthiness requirements. The sample is examined after the test, which shows no permanent plastic deformation. This result indicates the strength of the landing gear meets the design requirements. In a nutshell, the limited drop test meets the airworthiness standards; the experimental results meet the design requirements, which could be used to verify the correctness of dynamic simulation analysis.
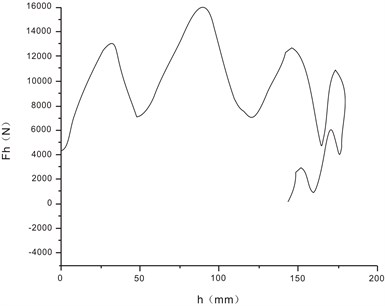
Fig. 3Buffer energy absorption of the strut landing gear of a particular aircraft
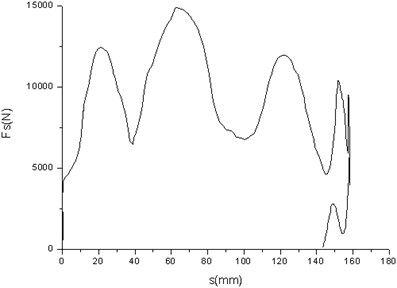
a) Buffer energy absorption of the drop test
b) System energy absorption of the drop test
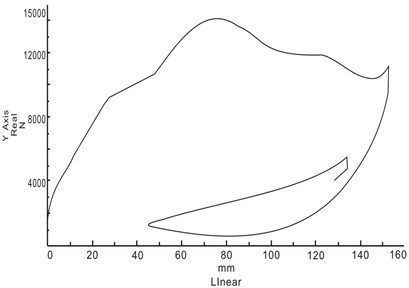
Fig. 4System energy absorption of the strut landing gear of a particular aircraft
a) System energy absorption of drop test
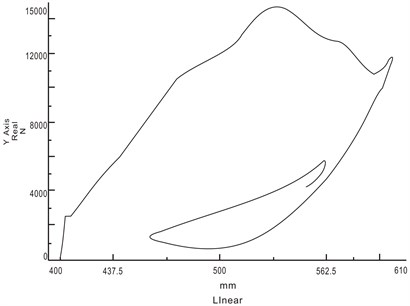
b) System energy absorption of simulation
Fig. 3(a) and Fig. 4(a) respectively correspond with the buffer capacity of the drop test, the energy absorption of buffer and the energy absorption of system. Fig. 3(b) and Fig. 4(b) respectively correspond with the buffer capacity of the drop test, the energy absorption of buffer and the energy absorption of system, which are obtained from the simulation. As can be seen from the buffer capacity of the drop test, the compression speed is very fast at the beginning of initial compression stage, with the interaction forces increasing rapidly. With the increase of compression distance, air spring force is gradually increased to the maximum, and then the buffer compression stroke reached the maximum. The comparison between simulation and test is shown in Table 2. Compared to the test results, the maximum vertical load error is 1.4 %, the maximum stroke error of buffer is 3.4 %, the energy absorption error of buffer is 5.9 %, the efficiency coefficient error of buffer is 0.5 %, and the efficiency coefficient error of system is 3.3 %.
Table 2Contrast between results of simulation and test
System performance | Maximum stroke of buffer , mm | Maximum vertical loads , N | Energy absorption of system , J | Efficiency factor of buffer , % | Efficiency factor of system , % |
Results of simulation | 152.7 | 15226 | 2008 | 64.6 | 69.8 |
Results of test | 158.1 | 15440 | 1897 | 64.9 | 67.6 |
Deviation between two results | 3.4 | 1.4 | 5.9 | 0.5 | 3.3 |
True and reliable test results can be used to verify the accuracy of the simulation model. Comparing the simulation results with the test results, dynamic simulation data is very close to the data obtained from drop test. Besides, the relative error of simulation is small enough to verify the accuracy of dynamic modeling technology of landing gear, which provides the theoretical basis for subsequent research of dynamic analysis of landing gear.
3. Landing dynamic simulation analysis of landing gear with multi-struts
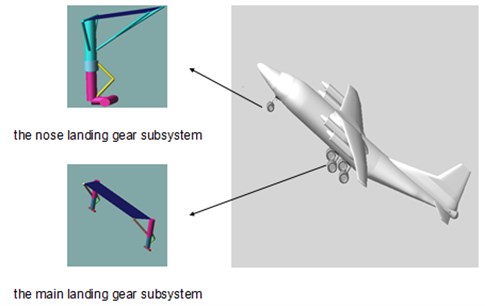
This paper studies the landing loads distribution of post landing gear. Based on a large aircraft as the prototype, the similar model is established. According to the characteristic of forces and motions, a full-size dynamic simulation analysis model in software ADAMS/Aircraft is defined based on the validated and reliable dynamic modeling technology of landing gear, which includes an airframe subsystem, the nose landing gear subsystem, and the main landing gear subsystem.
Based on the basic module, ADAMS/Aircraft is a special module used to analyze aircraft dynamic performance, in which can create Fuselage model, landing gear model, and hanging model and so on various subsystems. In ADAMS/Aircraft Standard Interface, using assembly command, various subsystems can be assembled into a full-aircraft, and then are modified appropriately according to the need. Due to the topology structure in the assembly, the topology relationship between subsystems does not need to be considered. The full-aircraft model established is shown in Fig. 5.
Landing gear landing performance can be obtained according to the dynamic simulation analysis of landing gear symmetrical and asymmetrical landing process using the full-aircraft model. In this simulation analysis, the lift is calculated from the aircraft landing lift coefficient without considering the attached lift attributes. Then, the lift is deducted from the aircraft landing weight to reach the actual landing condition. In this simulation, the adjusting-parameters are all set from the qualitative analysis, which meet the landing speed requirement of aircraft landing gear design standard. To ensure the vertical landing speed of landing gear is 3000 mm/s, the minimum distance from the ground to landing gear wheel should be increased to 459.2 mm.
Fig. 5Full-aircraft assembly model
3.1. Simulation analysis for the symmetrical landing process
3.1.1. Simulation analysis with the initial pitch angle
The initial parameters are needed in the simulation analysis of landing gear with multi-struts is shown as follows. The aircraft quality is 40000 Kg. The coordinate of the mass center of aircraft is (14387, 0.4332). The distance between the runway and wheel lowest point is 459.2 mm. The aircraft initial yaw angle, pitch angle, roll angle is 0 deg, 5 deg and 0 deg. The initial velocity of center of gravity at the axis is –55555.6 mm/s. According to parameters provided by the table, dynamic simulation is conducted.
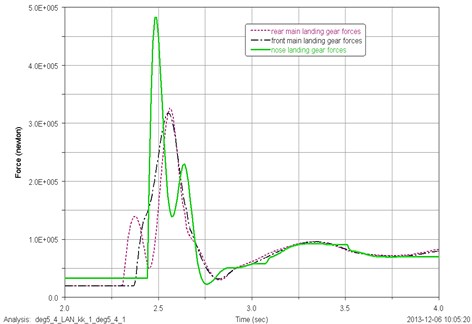
The load distribution of the single landing gear strut during landing is shown in Fig. 6. As can be seen from the curve, when the aircraft lands at the initial pitch of 5 deg, the load exerted on landing gear strut grows rapidly to the maximum value. After several fluctuations, the load tends to be stable. The maximum load of single strut of the nose landing gear, the exerted on landing gear, and the rear main landing gear is 482640 N, 317650 N, 325990 N, the corresponding time is 2.49 s, 2.55 s, 2.56 s. As can be seen from the above, the maximum load exerted on the nose landing gear strut is much larger than the single strut of the front main landing gear and the rear main landing gear, the maximum load exerted on the front main landing gear and the rear main landing gear is the same.
Fig. 6Load distribution of each landing gear strut for landing at the initial pitch angle of 5 deg
3.1.2. Effects of different pitch angle on aircraft landing load distribution
To study the effects of different pitch angle on aircraft landing load distribution, the load distribution of each landing gear at different pitch angle is analyzed in this simulation, which include 0.25 deg, 0.5 deg, 0.75 deg, 1.0 deg, 1.25 deg, 1.5 deg, 1.75 deg, and 2 deg. Since the landing conditions at the pitch angle of 0.75 deg and 2 deg is special, the load distribution of them is analyzed as follows.
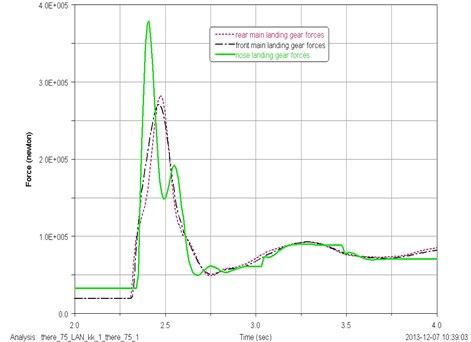
The load distribution of each landing gear landing at the initial pitch angle of 0.75 deg is shown in Fig. 7. When the aircraft lands at 0.75 deg pitch angle, the maximum load exerted on the nose landing gear, the front main landing gear, and the rear main landing gear is 378810 N, 270920 N, and 282380 N, the corresponding time is 2.41 s, 2.46 s, and 2.47 s.
Fig. 7Load distribution of each landing gear strut for landing at the initial pitch angle of 0.75 deg
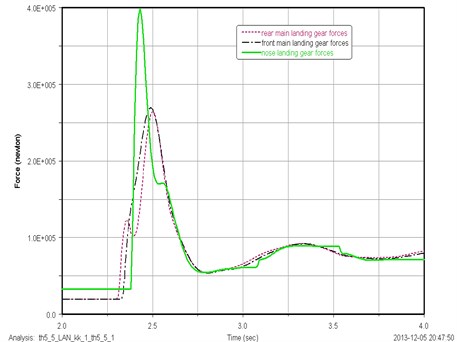
The load distribution of each landing gear landing at the initial pitch angle of 2 deg is shown in Fig. 8. When the aircraft lands at 2 deg pitch angle, the maximum load exerted on the nose landing gear, the front main landing gear, and the rear main landing gear is 398970 N, 269890 N, and 265090 N, the corresponding time is 2.43 s, 2.49 s, and 2.50 s.
Fig. 8Load distribution of each landing gear strut for landing at the initial pitch angle of 2.0 deg
The maximum load exerted on single strut of each landing gear at different pitch angle is shown in Table 3. The maximum load changing with the pitch angle of each landing gear strut is shown in Fig. 9. As can be seen from the Fig. 9, within a certain range, along with the increase of pitch angle, the maximum load decreases first and then increases, which is exerted on the damper strut of the nose landing gear and the nose landing gear. The maximum load of the damper strut of each landing gear occurs at pitch angle of 0.25 deg. Besides, the maximum load exerted on the damper strut of the rear main landing gear is normally lager than it exerted on the damper strut of the front main landing gear.
Fig. 9Maximum load changing with the pitch angle of each landing gear strut
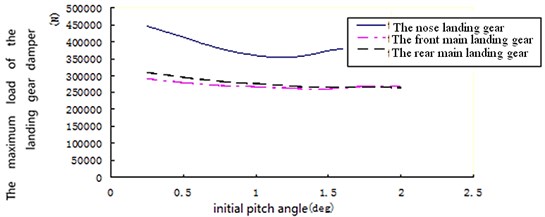
Table 3The maximum load exerted on the landing gear damper strut at different pitch angle in symmetrical landing
Initial angle (deg) | 0.25 | 0.5 | 0.75 | 1.0 | 1.25 | 1.5 | 1.75 | 2.0 |
Nose landing gear (N) | 445960 | 412690 | 378810 | 360210 | 354070 | 374110 | 386750 | 398970 |
Front main landing gear (N) | 290930 | 280050 | 270920 | 266590 | 262400 | 261300 | 268970 | 269890 |
Rear main landing gear (N) | 309980 | 295000 | 282380 | 276430 | 268600 | 267340 | 267560 | 265090 |
3.1.3. Load distribution of each landing gear
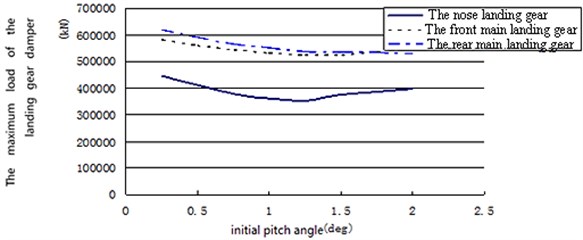
As can be seen above, the load exerted on single landing gear strut or single tire is analyzed. In order to obtain the landing load distribution of each landing gear, the superposition of strut load of the exerted on landing gear and the rear main landing gear should be carried out. The landing load distribution of each landing gear strut at different initial pitch angle is shown in Fig. 10. As can be seen from Fig. 10, most of the landing load is exerted on the exerted on landing gear and the rear main landing gear. Meanwhile, the landing load exerted on the nose landing gear is respectively small. For example, when the aircraft lands symmetrically at the initial pitch angle of 1.25 deg, the load exerted on the rear main landing gear has the highest ratio, approximately accounting for 38.4 % of the total landing load. The load exerted on the front main landing gear is a little smaller than the rear main landing gear, approximately accounting for 37.9 % of the total landing load. The load exerted on the nose landing gear is respectively the smallest, approximately accounting for 23.7 % of the total landing load. By analyzing the data in figures, it is obvious that the range of load exerted on landing gear and the rear main landing gear is small, with the change of initial pitch angle. Meanwhile, the range of load exerted on the nose landing gear is respectively larger.
Fig. 10Landing load distribution of each landing gear
3.2. Simulation analysis of asymmetrical landing
The initial parameters needed in simulation analysis of multi-strut landing gear landing asymmetrically are shown as follows. The aircraft quality is 40000 Kg. The coordinate of the mass center of aircraft is (14387, 0.4332). The distance between the runway and wheel lowest point is 459.2 mm. The aircraft initial yaw angle, pitch angle, roll angle is 0 deg, 5 deg and 5 deg. The initial velocity of center of gravity at the axis is –55555.6 mm/s. According to parameters provided by the table, dynamic simulation is conducted. During asymmetrical landing, the left tire and the right tire is loaded at different time. At first, one side of the tire lands. With a lag, the other side of tire lands as well. With both side of tire simultaneously bearing the load, both loads grow consistently. The above analysis is consistent with the actual situation, the simulation results are reasonable.
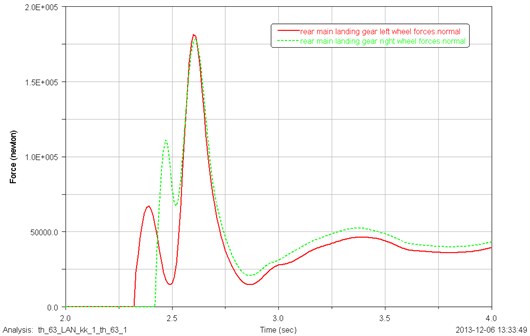
When landing asymmetrically, the vertical load distribution of the front main landing gear and rear main landing gear tire are shown in Fig. 11, Fig. 12. As can be seen from the figure, the left tire of the front main landing gear firstly suffered the load compared to the right tire. The maximum vertical load exerted on the right tire is 13600 N larger than the left. What’s the same, the left tire of the rear main landing gear firstly suffered the load compared to the right tire. The maximum vertical load exerted on the right tire is 3150 N larger than the left.
Fig. 11Vertical load distribution of the left and right tire of front main landing gear for asymmetrical landing
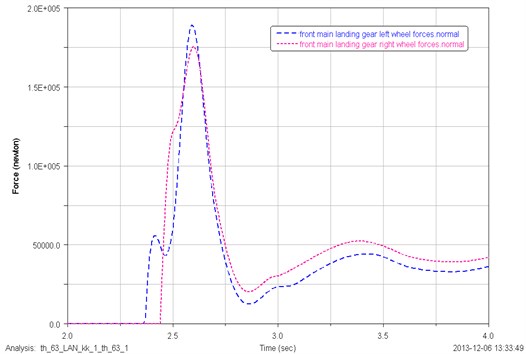
Fig. 12Vertical load distribution of the left and right tire of rear main landing gear for asymmetrical landing
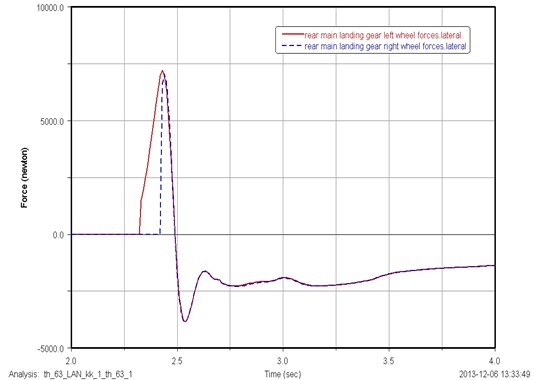
Due to the different start landing time of the left and right tire, lateral load occurs during asymmetrical landing. In the initial landing stage, the lateral forces of left and right tire are not the same according to uneven stress of them. With the continuation of the process of landing, the loads exerted on the left and right tire grow similarly and lastly approach the same state, when the lateral forces completely eliminated. The lateral load distribution of the front main landing gear and rear main landing gear is shown in Fig. 13 and Fig. 14. As can be seen from the figures, the direction of the lateral force exerted on landing gear tire is not fixed. The left tire of the after main landing gear occurs early than the right. The left tire of the nose main landing gear occurs early than the right. After several reciprocations, the lateral force of both tire grows being equal.
Fig. 13Lateral load distribution of the left and right tire of front main landing gear for asymmetrical landing
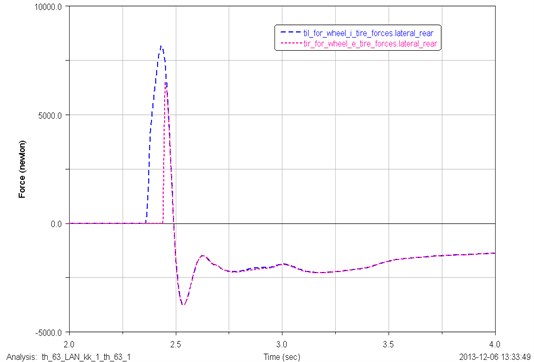
Fig. 14Lateral load distribution of the left and right tire of rear main landing gear for asymmetrical landing
The maximum load and corresponding time of the left and right tire of the nose and rear main landing gear is shown in Table 4 for asymmetrical landing.
Table 4Tire load distribution of the main landing gear in asymmetrically landing
Load distribution | Maximum vertical load (N) | Duration time of maximum vertical load (s) | Maximum lateral load (N) | Duration time of maximum lateral load (s) |
Left tire of the front main landing gear | 189350 | 2.59 | 8162 | 2.43 |
Right tire of the front main landing gear | 175750 | 2.60 | 6516 | 2.45 |
Left tire of the rear main landing gear | 181640 | 2.60 | 7207 | 2.43 |
Right tire of the rear main landing gear | 178490 | 2.61 | 6979 | 2.44 |
4. Conclusions
A dynamic model for post landing gear is introduced to study the reasonable modeling technology for landing gear, and the drop test is referred as supplement. Based on the validated dynamic modeling technology and the landing dynamic theory of landing gear with multi-struts, a dynamic simulation model for the landing gear with multi-struts is established by using the ADAMS/Aircraft software. In the Standard Interface of ADAMS/Aircraft software, the load distribution of each landing gear strut during the symmetrical and asymmetrical landing process is analyzed. The results show that the load distribution of each landing gear is balanced during the symmetrical landing process, and the rear main landing gear bears the highest ratios of load. The initial pitch angle has certain influences on the distribution of the landing load. During the asymmetrical landing, the load distribution is reallocated. In the initial landing stage, the lateral load occurs. With the stability of landing process, the lateral load gradually disappears. The results offers valuable reference for the landing gear with Multi-struts layout design of large military aircraft.
References
-
Bovais C. S., Haupt M. E., Toot P. L. Flight testing with sub-scale remotely piloted drop models. AIAA Paper, 1992, p. 92-4079.
-
Daniels J. A method for landing gear modeling and simulation with experimental validation. NASA Contractor Report 201601, 1996.
-
Adams D. S. Mars exploration rover airbag landing loads testing and analysis. Pasadena, CA, Jet Propulsion Laboratory, National Aeronautics and Space Administration, 2004.
-
Bennett T., Fox R. Design, development and drop testing of a 30,000 lb ballistic air delivery and soft landing system. Proceedings of the 19th AIAA Aerodynamic Decelerator Systems Technology Conference and Seminar, 2007.
-
Dismond Harriett R. NASA High-speed 2D photogrammetric measurement system. Langley Research Center, NASA/TM, 2012.
-
Wang X., Carl Udo Fuzzy control of aircraft semi-active landing gear system. 37th AIAA Aerospace Sciences Meeting and Exhibit, Reno, p. 1999, p. 1-11.
-
Ghiringhelli G. L. Testing of semi-active landing gear control for a general aviation aircraft. Journal of Aircraft, Vol. 37, Issue 4, 2000, p. 606-615.
-
Lyle K. H., Jackson K. E., Fasanella E. L. Simulation of aircraft landing gears with a nonlinear dynamic finite element code. Journal of Aircraft, Vol. 39, Issue 1, 2002, p. 142-147.
-
Khapane P. D. Gear walk instability studies using flexible multi-body dynamics simulation methods in Simpack. Aerospace Science and Technology, Vol. 10, Issue 1, 2006, p. 19-25.
-
Lernbeiss R., Plöch M. Simulation model of an aircraft landing gear considering elastic properties of the shock absorber. Journal of Multi-Body Dynamics, Vol. 221, Issue 1, 2007, p. 78-86.
-
Kong J. P., Lee Y. S., Han J. D., et al. Drop impact analysis of smart unmanned aerial vehicle (SUAV) landing gear and comparison with experimental data. Materials Science and Engineering Technology, Vol. 40, Issue 3, 2009, p. 192-197.
-
Cai-Jun Xue, Yu Han, Wen-Gang Qi,et al. Landing-Gear drop-test rig development and application for light airplanes. Journal of Aircraft, Vol. 49, Issue 6, 2012, p. 2064-2076.
About this article
This work is supported by Jiangsu Provincial Natural Science Foundation of China (No. BK2012795), Operating Expenses of Basic Scientific Research Project (No. NS2014009) and Priority Academic Program Development of Jiangsu Higher Education Institutions.
