Abstract
A new approach for acoustic emission (AE) source type identification based on harmonic wavelet packet (HWPT) feature extraction and hierarchy support vector machine (H-SVM) classifier is proposed for solving the fatigue damage identification problem of helicopter moving component. In this approach, HWPT is employed to extract the energy feature of AE signals on different frequency bands, as well as to reduce the dimensionality of original data features. We trained the H-SVM classifier on a subset of the experimental data for known AE source type, and then tested on the remaining set of data. Also, the pressure off experiment on specimen of carbon fiber materials is investigated. The experimental results indicate that the proposed approach can implement AE source type identification effectively, and achieves better performance on computational efficiency and identification accuracy than wavelet packet (WPT) feature extraction and RBF neural network classification.
1. Introduction
Due to the quick-wear nature of the helicopter moving components such as cracks, which seriously endangers the stability and safety of helicopter, it is necessary to monitor the initiation of cracks and to master the developing trend of the cracks. Acoustic emission (AE) is a noticeable choice of nondestructive testing method because of its high sensitivity. AE has been proved to be a very sensitive method for defect recognition of composite materials which have been used in typical application areas such as aerospace, vehicle industry and infrastructure. Automatic recognition of defect types based on their AE signals has attracted increased attentation, and many recent studies have been published [1-3]. In the AE technique, AE source type identification is used to determine the model of fatigue damage.
AE source type identification is a typical pattern recognition problem, which includes two main parts, i.e., feature extraction and pattern classification. Since AE signals are non-stationary signals, the traditional techniques in the time and frequency domains are not suitable for analyzing them. The wavelet transform (WT) has been demonstrated as an alterative tool for feature extraction, in which the scaling operation in wavelet transform produces a series of wavelet functions with different window sizes, enabling multi-resolution analysis that is suitable for representing the non-stationary signals. A major drawback of wavelet transform is its low-frequency resolution in the high frequency range. However, the wavelet packet transform (WPT), in contrast, can decompose the detailed information of the signal, which has been successfully applied in the feature extraction stage of sensor fault and machine health diagnosis [4-5]. Among the different types of wavelets developed so far, the harmonic wavelet possesses compact the frequency expression and have overcame the limitations of traditional wavelet such as energy leakage, inflexible frequency band selection, different frequency resolutions on different levels, etc [6-7]. Hence, in this research, harmonic wavelet packet transform is employed to extract the feature of AE sources.
Numerous pattern recognition methods have been developed within the intelligent systems. Among the algorithms, statistical learning method and ANN are the mostly used ones in AE signals analysis of composite materials. For the past two decades, ANN has been widely applied in AE signal classification problems based on learning patterns from data samples or empirical data modeling [8-11]. However, as a typical machine learning classifier, the ANN method is based on the empirical risk minimization principle, which cannot always minimize the actual risk. The traditional neural network approaches have limitations on generalization ability, which bring risks to over-fit the training data. This deficiency is due to the optimization algorithms used in ANN for parameters selection and the statistical measures used to select the model. At the same time, the effectiveness of the ANN methods extremely depends on the number of training samples. In most cases, it is difficult to obtain a large amount of AE signal samples in composite material, hencethe effectiveness of the ANN methods can hardly be improved.
In order to overcome the disadvantages of ANN, support vector machine (SVM) is used for classification of AE sources. SVM, based on statistical learning theory, is gaining applications in the areas of machine learning, computer vision and pattern recognition because of the high recognition accuracy and good generalization capability. The SVM training phase seeks a global optimal solution and avoids over fitting, hence it has the ability to deal with a large number of features. It is very suitable for pattern recognition with small samples.
In this paper, we discuss the application of harmonic wavelet packet in feature extraction and hierarchy support vector machine classification in AE source type identification, and evaluate the algorithm using pressure off experiment on specimen of carbon fiber materials.
2. AE source feature extraction based on harmonic wavelet packet
2.1. Harmonic wavelet
In essence, the wavelet transform characterizes the correlation or similarity between the signal to be analyzed and the mother wavelet function. Such a correlation is expressed by the wavelet coefficients associated with the wavelet transform, which can be calculated through a correlation operation between the signal and the conjugate of the chosen mother wavelet :
If the signal is closely correlated with the mother wavelet , the wavelet coefficient will be large, indicating a good match between the mother wavelet and the signal being analyzed. As a result, the information embedded in the signal can be extracted by analyzing the wavelet coefficients with local maxima. In 1993, professor D. E. Newland [12-13] from Cambridge University proposed the harmonic wavelet which has ideal “Box-like” characteristic in frequency domain. In this study, the harmonic wavelet is chosen as the mother wavelet, due to the simplicity of its expression in the frequency domain, and is defined as:
where and are the scale parameters. These parameters are real but not necessarily the integers. By taking the inverse Fourier transform of , the time domain expression of the harmonic wavelet is obtained as:
If the harmonic wavelet is translated by a step , in which is the translation parameter, a generalized expression that is centered at with a bandwidth of can be obtained as:
Based on the generalized expression, the harmonic wavelet transform of a signal can be performed as:
where is the harmonic wavelet coefficient. By taking the Fourier transform of Eq. (5), an equivalent expression of the harmonic wavelet transform in the frequency domain can be expressed as:
where is the Fourier transform of the signal , and is the conjugate of , which is the Fourier transform of the harmonic wavelet at the scale . Since the harmonic wavelet has compact frequency expression, as shown in Eq. (2), the harmonic wavelet transform can be readily obtained through a pair of Fourier transform and inverse Fourier transform operations.
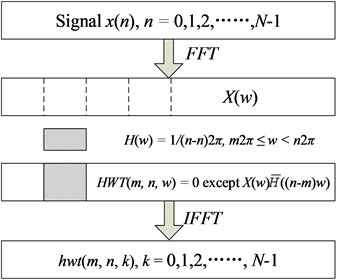
As shown in Fig. 1, after taking the Fourier transform of a signal to obtain its frequency domain expression , the inner product of and the conjugate of the harmonic wavelet at the scale is calculated. Finally, the harmonic wavelet transform of the signal , denoted as is obtained by taking the inverse Fourier transform of the inner product .
Fig. 1Algorithm for implementing the harmonic wavelet transform
2.2. Harmonic wavelet packet algorithm
The scale parameter and determine the bandwidth that the harmonic wavelet covers. Similar to the Wavelet Packet Transform (WPT), the number of frequency sub-bands for the Harmonic Wavelet Packet Transform (HWPT) has to be s powers of , in which corresponds to the decomposition level for WPT. Accordingly, the signal can be decomposed into frequency sub-bands with the bandwidth in Hertz for each sub-band defined by:
where is the highest frequency component of the signal to be analyzed. Since the bandwidth of the harmonic wavelet is , the values for and of the HWPT have to satisfy the following conditions:
Thus the harmonic wavelet packet coefficients can be obtained as:
where is the decomposition level, is the index of the sub-band, and is index of the coefficient. The parameters and need to satisfy the following condition:
where
2.3. AE signal feature extraction
With AE signal decomposed into a number of sub-bands, the features can be extracted from the harmonic wavelet packet coefficients in each sub-band to incorporate AE source type information. The fact that signals in different frequency bands follow different energy distribution is caused by the information difference contained in the signals. For the AE signal, because of different AE source features, the characteristic energy distribution coefficient of harmonic wavelet packet is selected as the features. The energy content of a signal can be calculated based on the coefficients of the signal’s transform. In the case of a HWPT, the coefficients quantify the energy associated with each specific sub-band. The details of feature extraction procedure are shown as follows.
Step 1. Normalizing the AE signal using:
where is the AE signal, and are the mean and standard deviation of .
Step 2. Decomposing with four levels of harmonic wavelet packet transform, and getting the coefficients vectors of the sixteen nodes, where represents , in which is the length of AE signal.
Step 3. Calculating the energy of each node and normalizing them:
Step 4. The feature vector is used to identify the AE source types.
3. AE source identification using hierarchy support vector machine (H-SVM) classifier
AE source identification is a typical pattern recognition problem with small sample, because in most cases, it is difficult to obtain a large amount of AE signal samples in composite material to train the classifiers. In this paper, support vector machine (SVM) is employed as the baseline classifier, because of its good generation ability for the two-category classification problem with small sample [14].
The concept of composite damage was proposed by Professor K. L. Reifsnider [15] in 1977 during his research on composite fatigue damage. There are four damage types of fiber composite, i.e. matrix cracking, interfacial debonding, delamination and fiber fracture. The task of AE source identification is to distinguish the damage type using the AE signals. Because the features of AE signal for interfacial debonding and delamination are similar and these two damage types always occur at the same time for the carbon fiber materials, in this paper, we only study three damage types, i.e., matrix cracking, interfacial debonding and fiber fracture. Obviously, AE source identification is a multi-classification problem.
There are two standard approaches to construct and combine the results from binary classifiers for a problem. The first one is the one-vs-rest method, in which each classifier distinguishes one class from the other classes, and the class label of the input is decided by winner-take-all method. Each classifier needs to be trained on the whole training set, and there is no guarantee that good discrimination exists between one class and the remaining classes. The second standard approach to combine binary classifiers is the one-vs-one method, in which the decision is made by majority voting strategy. This requires training and testing of , binary classifiers. This approach is prohibitive when is large.
Thus, we chose a binary hierarchical classification structure as shown in Fig. 2. Each node is a binary classifier. Coarse separation among classes occurs in the beginning (at upper levels) in the hierarchy and a finer classification result is obtained in later (at lower levels). In the top node, we divide the original 4 classes into two smaller groups of classes (macro-classes). This clustering procedure is repeated in subsequent levels, until there is only one class in the final sub-group. This hierarchical structure decomposes the problem into 3 binary sub-problems. For testing, only about classifiers are required to traverse a path from top to bottom.
Fig. 2Hierarchical multi-classification structure for AE source identification
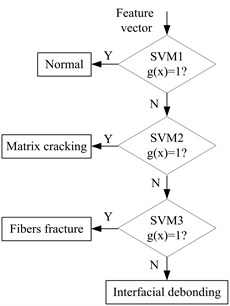
In this paper, the standard k-means clustering is used to design the binary hierarchical structure, as shown in Fig. 2. SVM1, SVM2 and SVM3 are three binary hierarchical structures acquired based on Step 1-Step 4 in 2.3 according to the different AE signal . is judgment function according to the result of the binary hierarchical structure. If , the corresponding binary hierarchical structure goes to “” direction; if not, goes to “” direction. SVM1 is used to classify Normal vs other three patterns, SVM2 is used to classify Matrix cracking vs Fibers fracture, Interfacial debonding, SVM3 is used to classify Fibers fracture vs Interfacial debonding.
In the training phase, the training samples are grouped according to Fig. 2. Then SVM1 to SVM3 are trained using the corresponding group of training samples. After that, by feeding the feature vector into the trained multi-classifier, the AE source type can be identified.
4. Experiment and results
4.1. Experimental setup
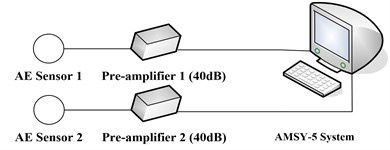
In order to evaluate the proposed method, a series of pressure off experiments were performed on the specimen of carbon fiber materials, which is one of the commonly used materials of helicopter moving component. The dimensions of all samples are all 418 mm×120 mm×2 mm. Two AE sensors are distributed on the carbon fiber specimen: one is 80 mm upward away from the central line of the specimen, and the other is 80 mm downwardaway from the central line of the specimen. The central point of the specimen is the force point. The loading speed of the pressure off experiment is 500 N/s. The AE signal measurement system is schematically shown in Fig. 3. The signal conditioning is performed by the pre-amplifiers. The conditioned signal (with a gain of 40 dB) is fed to the main data-acquisition board in which the AE waveforms and parameters are stored. The instruments and equipments used in the experiments are listed below:
1) MTS electro-hydraulic loading system (MTS 810 material test system).
2) Vallen AMSY-5 AE signal acquisition system with 16 channel and 16-bit, 10 MHz AD converter on each channel.
3) Two Vallen VS150-M AE sensors.
4) Two Vallen AEP4 pre-amplifiers (20-2000 KHz).
5) Vallen AE application software Vallen Visual AE.
6) Notebook computer.
Fig. 3Schematic of the AE measurement system
The sampling rate of the acquisition system is 1 MHz. In order to acquire all AE signals during the pressure off process, AMSY-5 works in continuous acquisition mode. Three specimens of carbon fiber materials with the same dimensions are under the pressure off experiment. For each AE source type, 50 groups of data are gathered.
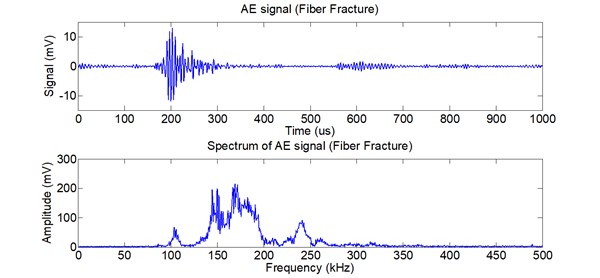
Fig. 4-6 show the AE signal and its spectrum of matrix cracking, the AE signal and its spectrum of interfacial debonding and the AE signal and its spectrum of fiber fracture, respectively. The spectrum of AE signal for the three types indicates that the energy distribution of the three types is different. The energy of matrix cracking mainly lies in low frequency band and the frequency band is very narrow. The energy of interfacial debonding distributes in wide frequency band. The frequency band of fiber fracture is wider than matrix cracking but narrower than interfacial debonding.
Fig. 4AE signal and its spectrum of matrix cracking
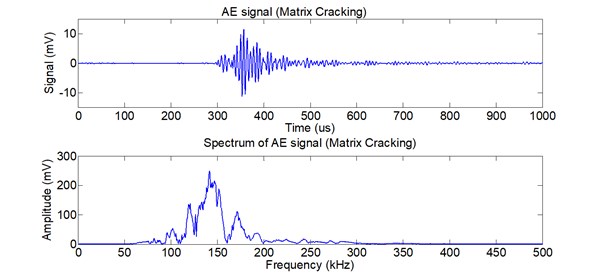
Fig. 5AE signal and its spectrum of interfacial debonding
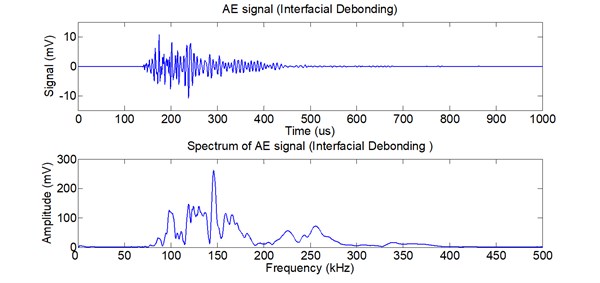
Fig. 6AE signal and its spectrum of fiber fracture
4.2. Feature extraction
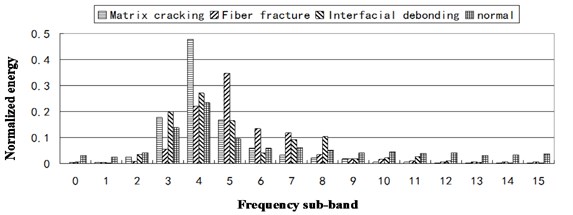
Firstly, the experiment of feature extraction is performed according to the algorithm given in section 2.3. The frequency band for each feature node is 31.25 KHz. Fig. 7 shows the normalized energy distribution for different AE sources at 15 frequency sub-bands.
As shown in Fig. 7, the energy distribution of normal state is approximately uniform in every frequency band, because the AE signal of normal state is approximately white noise. The energy distribution of Matrix cracking is mainly concentrated in frequency band 3, 4 and 5. The energy distribution of Fibers breaking is mainly concentrated in frequency band 4, 5, 6, and 7. The energy distribution of interface separation is broad, approximately from frequency band 3 to 8. Therefore, the AE source types can be distinguished using the harmonic wavelet packet energy features.
Fig. 7Normalized energy distribution for different AE source at 15 frequency sub-bands
4.3. AE source identification using H-SVM
The feature extraction stage acquired two groups of data, i.e., the training samples and the testing data. 20 groups of data for each type are used as training samples, and the other 30 groups of data for each type are used as testing data. The H-SVM classifier is trained using the training samples according to section 2. The kernel functions of all three SVMs in the H-SVM classifier are selected as RBF kernels, as shown in Eq. (14). The kernel width parameter , for each SVM is selected as 1.0:
Table 1 shows the AE source identification result using HWPT and H-SVM. The results indicate that the proposed approach can implement AE source type identification effectively.
In order to demonstrate the advantages of the HWPT feature extraction, acomparison study between WPT feature extraction plus H-SVM classifier and HWPT plus H-SVM is performed. For the WPT feature extraction, the wavelet function is selected as Db10, and the decomposing level is also 4. Similar to HWPT feature extraction, the element of the WPT feature vector is also the normalized energy in each frequency band. Table 2 shows the comparison of AE source identification results for HWPT plus H-SVM and WPT plus H-SVM, respectively. The results indicate that the identification rate of HWPT plus H-SVM is a little higher than WPT plus H-SVM. HWPT overcomes the energy leakage shortcoming of traditional wavelet, and can extract the energy feature more accurately.
Table 1AE source identification result using HWPT and H-SVM
AE source type | Test sample No. (Correct No.) | Identification rate (%) |
Matrix cracking | 30 (28) | 93.33 |
Fibers breaking | 30 (27) | 90.00 |
Interface separation | 30 (28) | 93.33 |
Normal | 30 (30) | 100.00 |
Table 2AE source identification comparison of HWPT and H-SVM with WPT and H-SVM
AE source type | Identification rate (%) | |
HWPT and H-SVM | WPT and H-SVM | |
Matrix cracking | 93.33 | 86.67 |
Fibers breaking | 90.00 | 83.33 |
Interface separation | 93.33 | 90.00 |
Normal | 100.00 | 100.00 |
5. Conclusions
In this paper, the HWPT feature extraction and H-SVM classifier are firstly applied to the AE source identification problem. The experimental system is built up and the pressure off experiments on specimen of carbon fiber materials are performed. The comparison results of HWPT plus H-SVM and WPT plus H-SVM indicate that the proposed approach can implement AE source type identification effectively, and it achieved better performance on computational efficiency and identification accuracy than WPT feature extraction. The proposed approach is very suitable for small sample problem. The efficient energy feature extraction ability and less computational time make the HWPT and H-SVM good candidate for efficient, on-line AE source identification.
References
-
Tittmann B. R., Yen C. E. Acoustic emission technique for monitoring the pyrolysis of composites for process control. Ultrasonics, Vol. 48, Issue 6, 2008, p. 621-630.
-
Liu Q., Chen X. Fuzzy pattern recognition of AE signals for grinding burn. Machine Tools & Manufacture, Vol. 45, Issue 7, 2005, p. 811-818.
-
Wang X. H., Zhu C. M., Mao H. L., Huang Z. F. Wavelet packet analysis for the propagation of acoustic emission signals across turbine runners. NDT & E International, Vol. 42, Issue 1, 2009, p. 42-46.
-
Rui Zhou, Wen Bao, Ning Li, Xin Huang, Daren Yu Mechanical equipment fault diagnosis based on redundant second generation wavelet packet transform. Digital Signal Processing, Vol. 20, Issue 1, 2010, p. 276-288.
-
Ning Li, Rui Zhou and Qinghua Hu Mechanical fault diagnosis based on redundant second wavelet packet transform, neighborhood rough set and support vector. Mechanical Systems Signal Processing, Vol. 28, 2012, p. 608-621.
-
Wenbin Zhang, Xiaojun Zhou, Yong Lin Harmonic wavelet package method used to extract fault signal of a rotation machinery. Journal of Vibration and Shock, Vol. 28, Issue 3, 2009, p. 87-89.
-
Ruqiang Yan, Robert X. Gao An efficient approach to machine health diagnosis based on harmonic wavelet packet transform. Robotics and Computer-Integrated Manufacturing, Vol. 21, Issue 4, 2005, p. 291-301.
-
Yuanxi Zhao, Yonggang Xu, Lixin Gao Fault pattern recognition technique for roller bearing acoustic emission based on harmonic wavelet packet and BP neural network. Journal of Vibration and Shock, Vol. 29, Issue 10, 2010, p. 162-165.
-
Vahid Emamian, Mostafa Kaveh, Ahmed H. Robust clustering of acoustic emission signals using neural networks and signal subspace projections. EURASIP Journal on Applied Signal Processing, Vol. 3, 2003, p. 276-286.
-
Ki-Bok Kim, Dong-Jin Yoon, Jung-Chae Jeong and Seung-Seok Lee Determining the stress intensity factor of a material with an artificial neural network from acoustic emission measurements. NDT & E International, Vol. 37, Issue 6, 2004, p. 423-429.
-
Qingli Dai, Kenny Ng and Jun Zhou Damage investigation of single-edge notched beam tests with normal strength concrete and ultra high performance concret speciments using acoustic emission techniques. Construction and Building Materials, Vol. 31, 2012, p. 231-242.
-
Newland D. E. Harmonic wavelet analysis, Part 1: theory. J. Vibration & Acoustic, Vol. 116, 1994, p. 409-416.
-
Newland D. E. Harmonic wavelet analysis, Part 2: wavelet map. J. Vibration & Acoustic, Vol. 116, 1994, p. 417-425.
-
Derya Avci, Asaf Varol An expert diagnosis system for classification of human parasite eggs based on multi-class SVM. Expert Systems with Applications, Vol. 36, Issue 1, 2009, p. 43-48.
-
Reifsnider K. L., Lauraitis K. N. Fatigue of filamentary composite materials. ASTM Standards and Engineering Digital Library, 1977.
About this article
This work is supported by the National Natural Science Foundation of China (Grant No. 61171196).
